
The coffee's gone cold, the investor call is tomorrow, and your spreadsheet still has a tab called “Valuation Final v7”. You're a Wellington founder with a promising product, a thin New Zealand customer base, a loss-making forecast, and an expansion plan that might work in Australia. The question isn't whether the business could become valuable. It's whether your numbers show how, when, and at what cash cost.
A discounted cash flow model won't turn uncertain forecasts into facts. It will expose the assumptions carrying the business. That's useful. Built properly, it becomes a runway, hiring, and fundraising tool, not a decorative valuation slide.
At a Wellington coworking space, a founder stares at a blank workbook. The template has US tax settings, a USD discount rate, and a neat terminal-value tab. It looks polished. It also has no idea how the company sells, collects cash, or survives between New Zealand and Australia.
That's the problem with imported DCF templates. They often assume a mature business with stable cash flows. An early NZ SaaS company has the opposite profile: limited history, customer concentration, changing pricing, negative operating cash flow, and a product roadmap that still affects hiring and reinvestment. Startup-specific research identifies losses, sparse financial histories, and high uncertainty as reasons conventional DCF outputs need careful interpretation (early-stage DCF research).
A founder should build the model before the round, not after the investor has already formed a view. It helps answer practical questions:
The model's job is to connect operating choices to cash. That makes it more useful than a heroic valuation number.
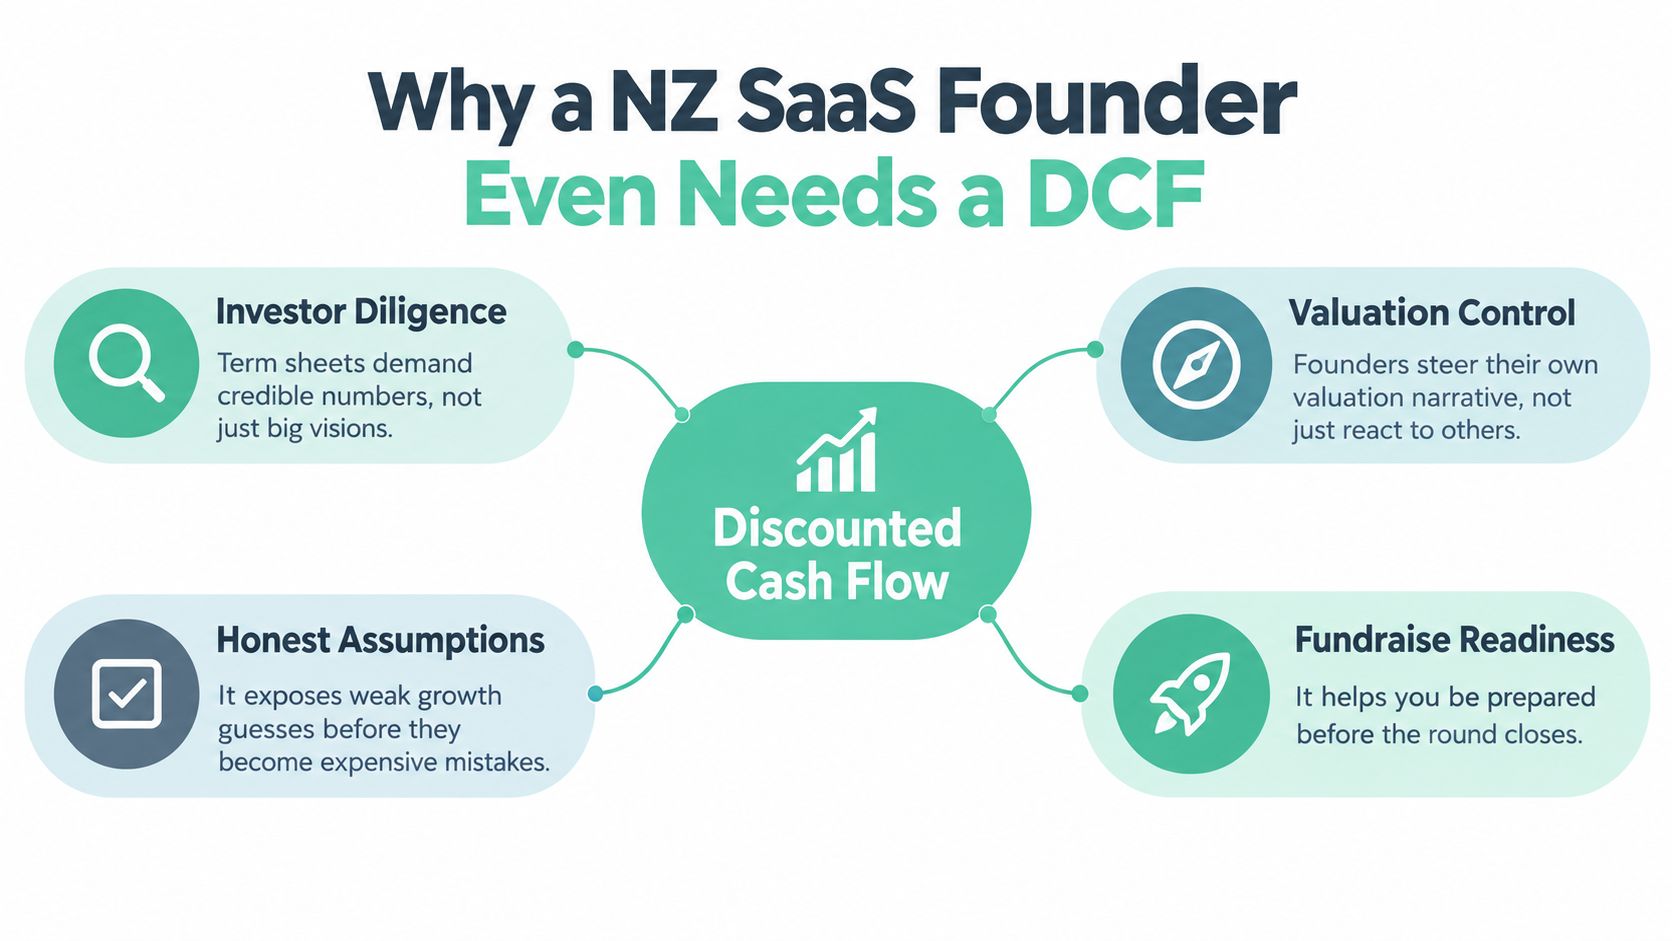
A DCF estimates present value by discounting future free cash flow. For a young SaaS business, though, the forecast is usually more valuable than the final answer. It shows which milestones matter and which assumptions are doing the heavy lifting.
You can also pair it with a practical guide to cash flow management for startups, because a company can look attractive on paper while running short of money next month.
A useful valuation conversation should include the operating plan, the cash plan, and the financing plan. That's also why founders should understand how to maximize value before selling, even if a sale isn't on the calendar. Better retention, stronger margins, and disciplined reinvestment improve both business quality and valuation logic.
Build the first version over a weekend. Keep it readable. If nobody on the team can explain a driver without opening another workbook, the model has become theatre.
Enterprise value doesn't move because you added another formatting tab. It moves because customers arrive, stay, expand, and generate cash at a sensible cost.
Start with these seven drivers:
Customer acquisition cost. CAC tells you what each new customer costs to win. Pair it with payback and gross margin, not revenue alone. If paid acquisition rises while conversion stays flat, the model should show slower cash recovery and a longer path to profitability.
Annual recurring revenue growth. Forecast ARR by customer cohort, not as one smooth line. New bookings, expansion, downgrades, and churn should each have a place. A tidy top-line curve can hide a leaky customer base.
Gross margin. Gross margin shows how much revenue remains after delivering the service. Cloud hosting, support, payment costs, implementation work, and third-party software belong here when they rise with customer usage.
Net revenue retention. Existing customers can expand, contract, or leave. Model those movements separately. A business that grows mainly by replacing churned customers has a different cash profile from one that expands inside its installed base.
Growth rate. New-logo velocity matters, but only alongside sales capacity and delivery limits. Growth that requires a matching wave of support staff may create less value than the headline ARR suggests.
Discount rate. This converts future cash into present value. It reflects risk, currency, funding conditions, and the return investors require.
Terminal value. This represents cash generation beyond the detailed forecast. It can dominate the result, so treat it as a conclusion to test, not a magical answer.
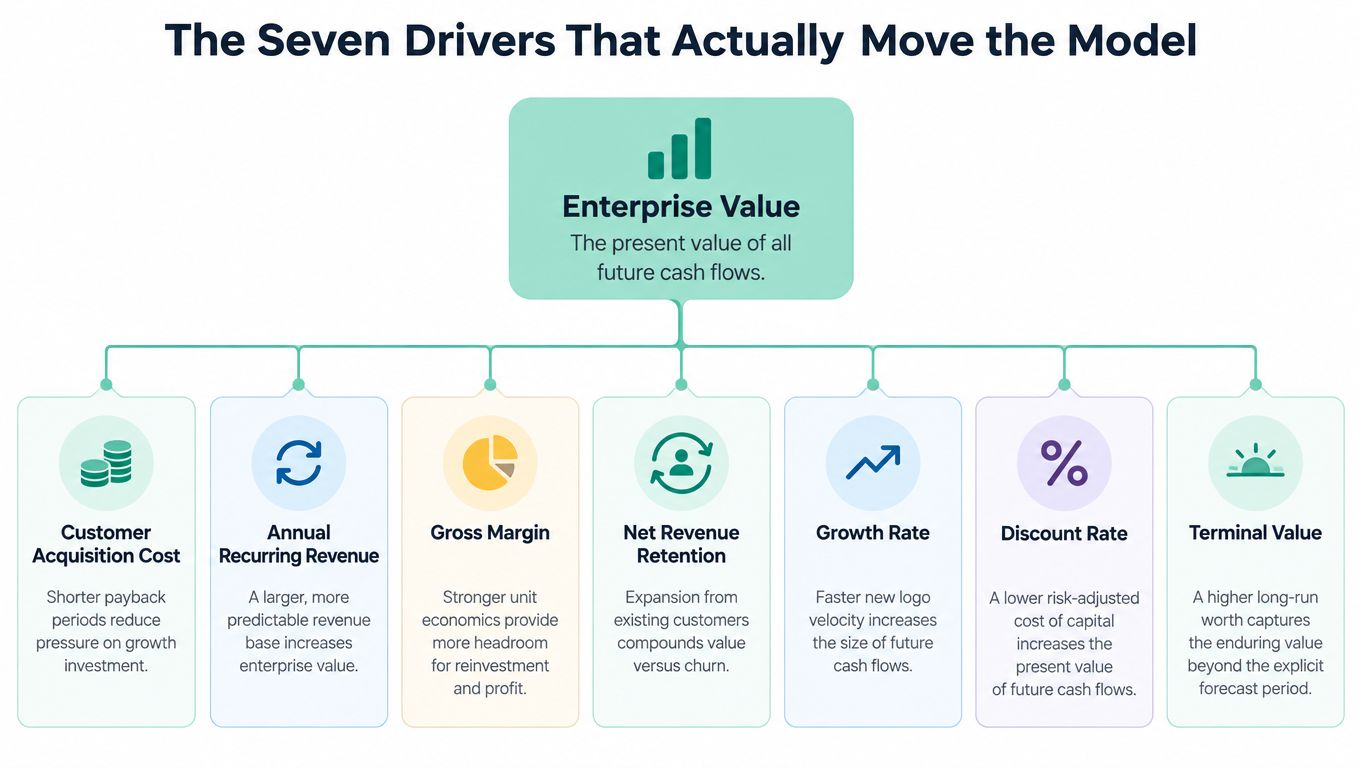
A small change in a major driver can ripple through several lines. Lower churn lifts retained ARR, support efficiency, gross profit, and later cash flow. A new hire affects payroll, delivery capacity, sales capacity, and the month when the company reaches cash break-even.
That doesn't mean you need a microscopic model. Some inputs rarely deserve elaborate treatment in an early company. Tiny office costs, minor software subscriptions, and perfect monthly allocation of every shared expense usually add noise. Model them sensibly, then spend your attention on retention, margin, sales efficiency, headcount, and reinvestment.
CFO rule: If a driver changes revenue, gross profit, cash timing, or the funding date, it deserves a clear assumption. If it only changes the appearance of a chart, leave it alone.
Write an assumption beside every major driver. State the evidence, owner, review date, and downside trigger. The formula is easy. Defending the assumption is the work.
A founder can show strong ARR growth and still run out of cash before the next raise. Build the model in operating order, then add financing separately. That keeps a funding round from masking a weak operating plan and turns the DCF into a runway and raise-planning tool, not a pretend transaction price.
Start with customer cohorts. For each cohort, forecast new bookings, opening recurring revenue, expansion, churn, price changes, invoicing, and collections. Then model cost of revenue, sales and marketing, research and development, and general overhead. Revenue is an accounting result. Cash follows contracts, invoices, payment terms, prepayments, and customer behaviour.
Apply New Zealand's 28% company income-tax rate, rather than copying a US workbook setting (New Zealand tax policy material). Early losses may mean little cash tax, but the tax schedule still needs to show when taxable profit arrives and how depreciation changes the timing.
Unlevered free cash flow starts with after-tax operating profit. Add back non-cash charges, subtract capital expenditure, and subtract changes in working capital. This is the cash generated by the business before debt and equity financing, so use a discount rate that matches that cash-flow definition.
Give working capital its own schedule. Track invoiced revenue, collections, prepaid costs, accounts payable, implementation timing, and annual-billing timing. A customer can improve ARR while worsening cash flow if the company funds onboarding or delivery well before payment.
Depreciation is not a cash payment, but it can reduce tax and therefore affect cash. Inland Revenue says eligible capital assets held for longer than one year generally require depreciation, with straight-line and diminishing-value methods available (IRD depreciation guidance). Diminishing-value depreciation brings deductions forward, while straight-line depreciation spreads them more evenly. The total deduction over an asset's life is the same under both methods, but the timing of the tax benefit differs.
For laptops, monitors, phones, and similar purchases, Inland Revenue's pooling method allows eligible assets with an individual adjusted tax value of $5,000 or less to be grouped (IRD pooling guidance). Keep the purchase in capital expenditure, then record tax depreciation in the tax schedule. Do not turn a pool into an operating expense just to make margins look cleaner.
Software requires a separate check. Depreciable intangible property is limited to assets listed in Schedule 14 of the Income Tax Act 2007, and the asset must have a finite useful life that can be estimated with reasonable certainty. Fixed-life intangible assets use straight-line depreciation. Goodwill does not depreciate under the ordinary rules (IRD intangible asset guidance).
| Schedule | Key lines | Feeds into |
|---|---|---|
| Revenue | New bookings, expansion, churn, pricing, collections | Revenue and working capital |
| Operating costs | Cost of revenue, sales, marketing, research, overhead | EBIT and margin |
| Working capital | Receivables, payables, prepayments, billing timing | Operating cash flow |
| Capital expenditure | Hardware, equipment, eligible development assets | Investment cash flow and depreciation |
| Tax | Operating tax, depreciation benefit, losses | After-tax operating profit |
| Free cash flow | After-tax profit, non-cash charges, capex, working capital | Discounted cash flow |
Make the bridge visible. Start with EBIT, subtract tax on operating profit, add back depreciation, subtract capital expenditure, and subtract the working-capital investment. Discount that cash figure. ARR and EBITDA help explain the business, but cash determines runway and the date when another raise becomes necessary.
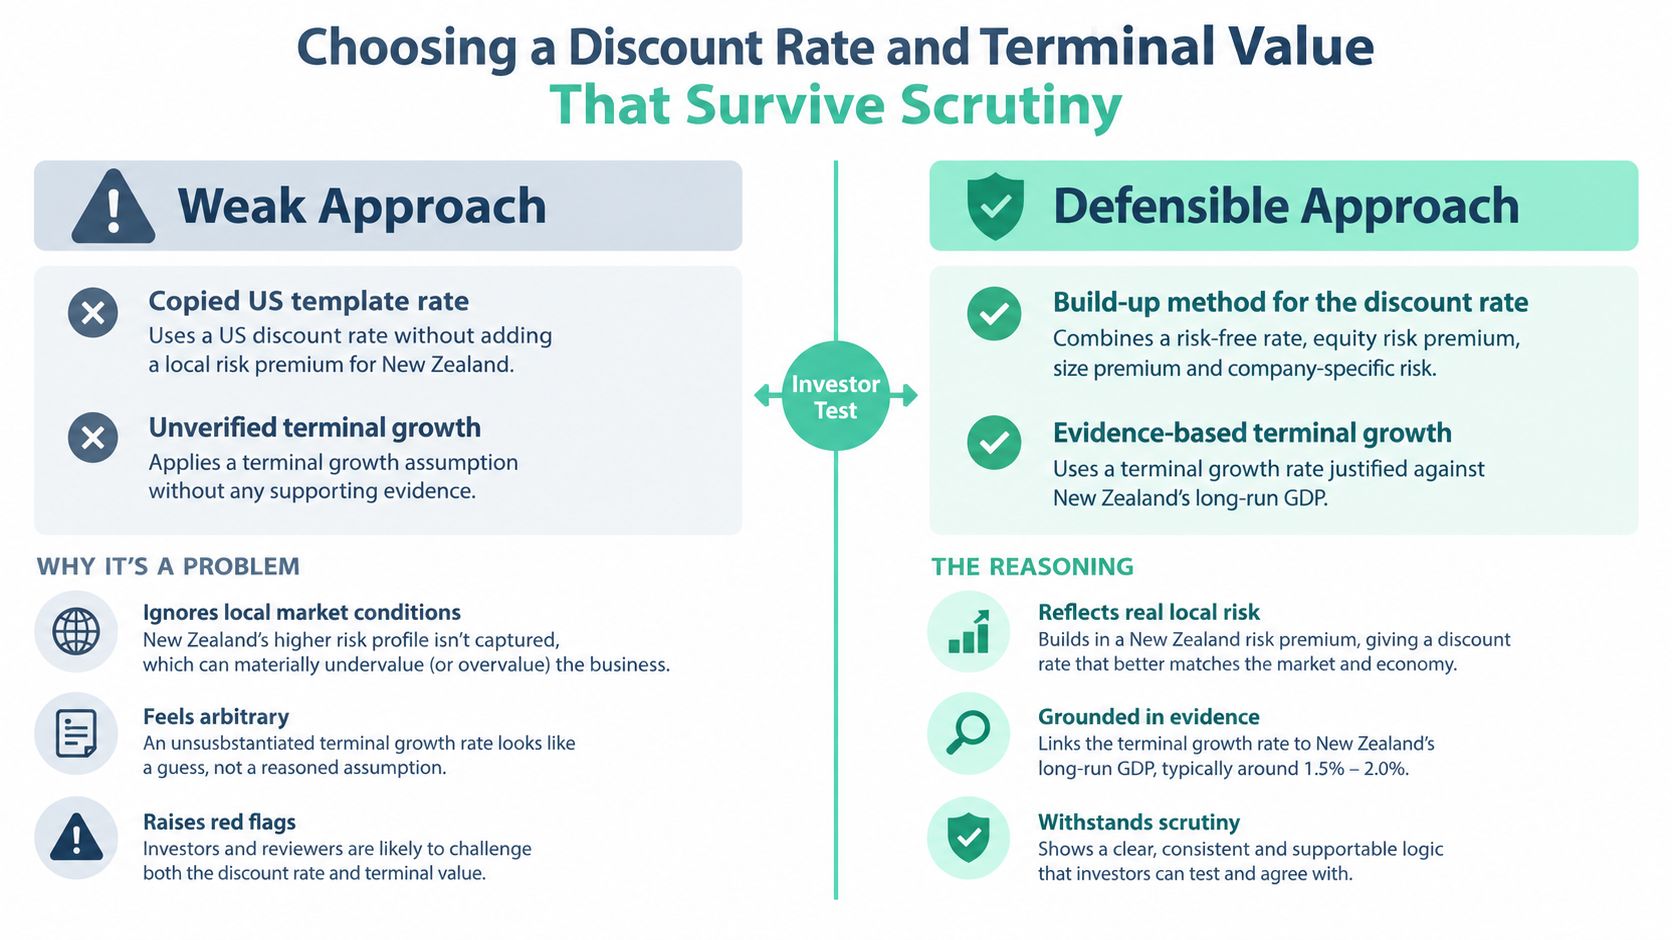
Founders often copy a discount rate from a US SaaS template, paste it into a NZD model, and call the result rigorous. It isn't. Currency, inflation, risk-free yields, funding conditions, and company risk must belong to the same story.
New Zealand Treasury publishes local assumptions for public-sector valuation work. As at 30 June 2025, its long-term assumptions included a 2.8% real forward rate and 2.0% long-term inflation, producing a 4.8% nominal long-term forward rate (New Zealand Treasury discount-rate assumptions). That is a transparent local reference for the risk-free and inflation components. It is not a private-company cost of capital.
A defensible build-up starts with a NZ risk-free anchor, then adds an equity risk premium, company-specific risk, size risk, and any relevant debt or currency exposure. Don't add every fear twice. If churn is weak, show weak churn in the downside cash flows. If customer concentration threatens revenue, model the lost account. Loading all those risks into the discount rate can make the forecast look clean while hiding the underlying operating problem.
New Zealand's OCR history shows why this input changes. The Reserve Bank has used the Official Cash Rate since March 1999, reduced it from 1.0% to 0.25% in March 2020, and later raised rates as inflation reached 7.2% before reductions began in August 2024 (Reserve Bank OCR history). A DCF should therefore show rate sensitivity. A single rate is a view, not a law.
Use both methods:
Neither method is automatically superior. Perpetual growth forces you to justify the long-run economics. An exit multiple forces you to ask whether a future buyer would pay that price for the business.
If terminal value contributes 70% of enterprise value, the model isn't precise. It's highly sensitive to the terminal assumptions. Run the same case through both methods, then vary the discount rate and terminal growth. If the answers sit far apart, investigate the operating forecast and terminal logic instead of averaging them into a comforting midpoint.
For a broader explanation of how early businesses are valued, startup company valuation explained is useful context. You can also compare the DCF with other company valuation methods, but don't use multiples to avoid confronting the cash forecast. Use them as a cross-check.
A loss-making startup doesn't have one valuation. It has a set of possible operating paths, each tied to cash, milestones, and financing pressure.
Call the cases downside, base, and upside. The downside should answer the question a worried board member asks, not the question a pitch deck wants to hear. Reduce conversion, increase churn, slow ARR growth, compress gross margin, and delay hiring where that reflects genuine execution risk. The base case should use the plan the team can defend. The upside case can be positive, but it must still obey sales capacity, implementation time, support load, and cash discipline.
Put the main differences on one page:
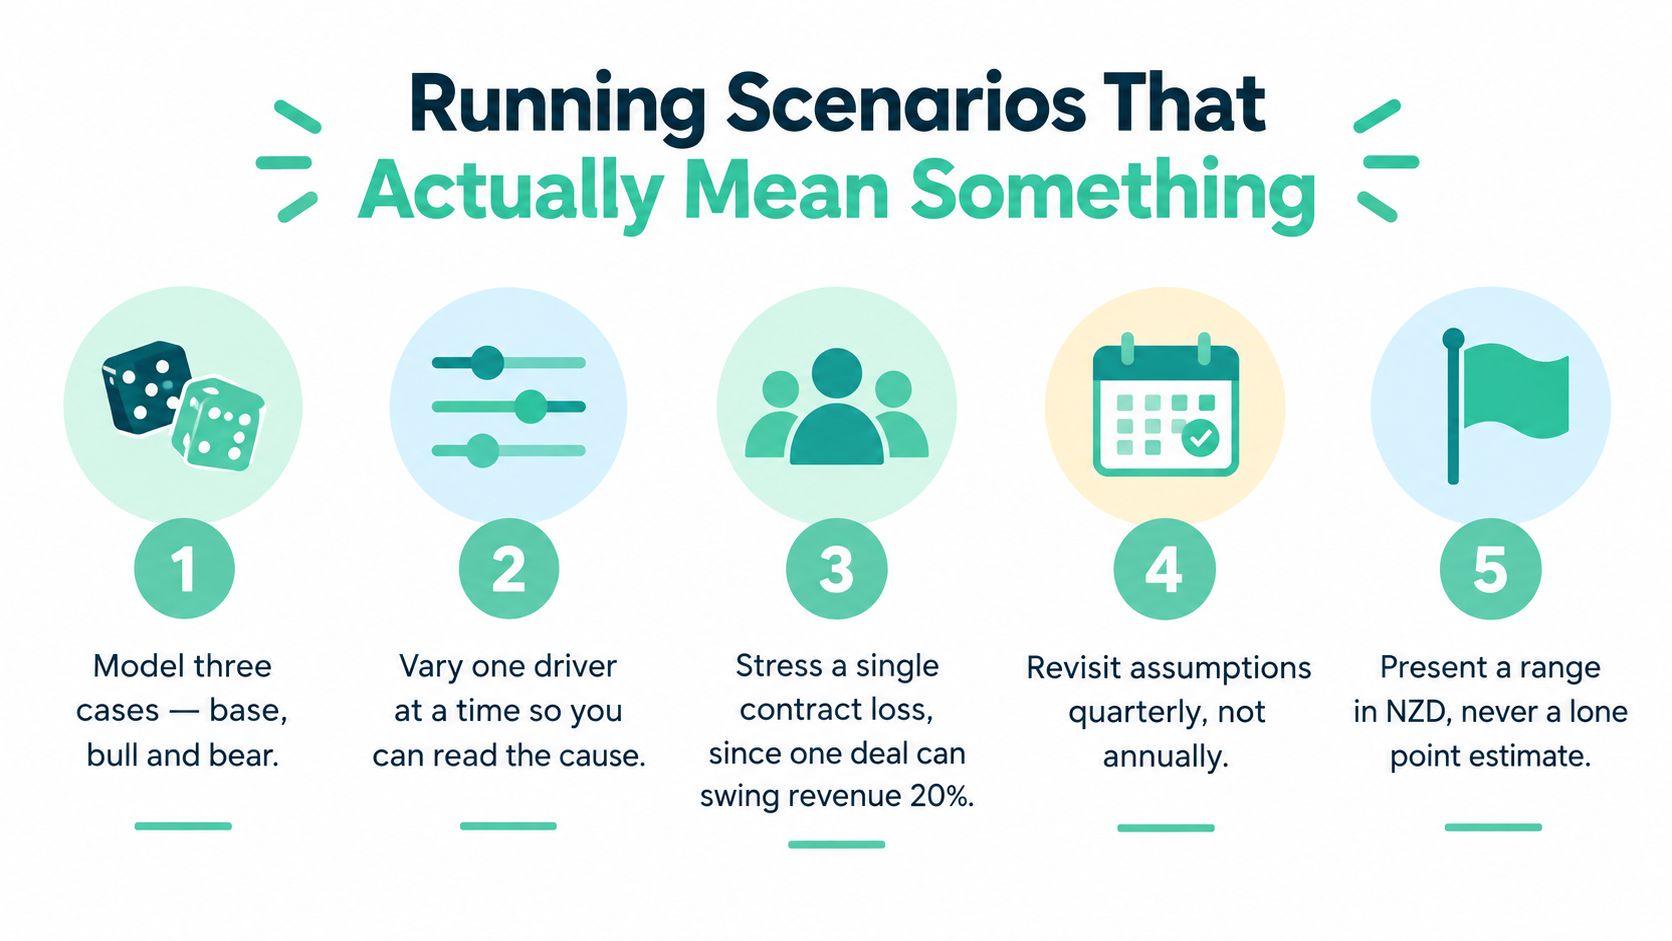
A small domestic customer base makes concentration risk especially sharp. One contract can distort a month, a quarter, or a forecast narrative. Don't hide that volatility in an average. Stress the customer directly, then show the effect on revenue, cash, runway, and the next funding date.
Run sensitivity tables for the discount rate and terminal growth, then separately test growth, margin, and churn. Vary one driver at a time first. That tells you what matters. Afterward, combine the bad-but-plausible movements into the downside case. Excel is perfectly adequate for this work, and you can run these analyses in Excel without buying a heroic planning platform.
Useful discipline: Update actuals monthly, revisit assumptions quarterly, and change the forecast only when the evidence changes.
Track new bookings, conversion, ARR, expansion, churn, gross margin, sales efficiency, headcount, cash balance, and remaining runway. The DCF then becomes a living operating dashboard. For a young company, that's far more valuable than defending a single number in a funding meeting.
A NZ SaaS forecast can look investable until someone checks the tax setting, currency assumptions, and treatment of product development. The workbook may calculate perfectly while the flawed judgement behind it undermines the runway and fundraising plan.
Mixing real and nominal inputs. Nominal cash flows require a nominal discount rate. Inflation-adjusted real cash flows require a real rate. Keep currency, pricing, inflation, and discount-rate assumptions on the same basis, or the present value becomes misleading.
Importing the wrong tax rate. US templates often carry US tax assumptions into a NZ company. Replace them with the 28% New Zealand company tax rate, then show how losses, tax timing, and depreciation affect cash rather than only accounting profit.
Using an overseas USD rate for NZD cash flows. A discount rate built for USD assets does not automatically fit a NZD forecast. Start with a local risk-free reference and add a risk premium that reflects customer concentration, early losses, execution, and funding dependence.
Double-counting CAC. If sales and marketing already includes acquisition spend, do not subtract CAC again below operating profit. Use CAC to test efficiency and cohort economics. Keep the expense in one place.
Treating goodwill as depreciable. As noted earlier, only qualifying Schedule 14 intangible assets with a finite useful life belong in the depreciation schedule. Park goodwill in the capital schedule as a non-depreciable line, so the tax workbook cannot claim a deduction for it.
Pretending terminal value is certain. A young SaaS company can have most of its calculated enterprise value sitting in the terminal period. Show a range, test terminal growth and the discount rate, and explain how much the result changes. Do not present a dollar-level valuation with false precision.
Building a model nobody can update. Separate assumptions, revenue, costs, tax, capital expenditure, working capital, free cash flow, and summary outputs. Add an owner and review date to material assumptions. If another person cannot change one driver without breaking formulas, the workbook is a key-person risk.
The practical fix is repetitive: reconcile actual revenue, trace major formulas, label every input as nominal or real, and keep cash schedules separate from accounting schedules. Then ask a colleague to change one assumption while you observe. A model that survives that test is useful for runway decisions and raise timing. One that does not is spreadsheet theatre.
Use a workbook with these tabs:
Use NZD throughout unless there's a clear reason not to. Lock the seven drivers. Apply the 28% tax rate. Anchor the discount rate to a local reference. Cross-check terminal value with both methods. Compare forecast against actuals every month.
The Treasury's published assumptions and Inland Revenue's depreciation guidance belong in your bookmarks. A practical financial forecasting template can help you start, but don't worship the layout.
The best model isn't the one with the most cells. It's the one your team understands well enough to argue with. Build the rough version this weekend, tie it to runway and fundraising milestones, then improve it as real customer data arrives.
NZ Apps covers the NZ and Australian app market and publishes practical resources for founders evaluating and building tech businesses. Visit NZ Apps to find regional company coverage and planning guidance that can support your next valuation and fundraising conversation.
Add your NZ or Australian app or tech company to the NZ Apps directory and get discovered by founders and operators across the region.
Get ListedReach tech decision-makers across New Zealand and Australia. Sponsored and dofollow editorial links, permanent featured listings, and sponsored articles on a DA30+ .co.nz domain.
See Options