
Which signals do you need? Ecommerce research can mean market sizing, competitor traffic, pricing, shelf visibility, marketplace demand, or hard sales data. Those questions sound similar, but they need different evidence.
No single platform covers every layer. A traffic panel can help size digital demand, yet it won't tell you whether a product is in stock on a retailer's site. A marketplace tool may show sold prices, but it won't explain the wider category or offline sales. Some figures are modelled. Others come from retailers, marketplaces, consumer panels, or point-of-sale systems.
That distinction matters in New Zealand and Australia. New Zealand's online market has grown from an established base. In 2017, online purchases already represented 8.1% of total retail spending, with NZ$3.6 billion spent online on physical products, according to NZ Post's 2018 ecommerce report. More recent data shows online spending holding up better than traditional retail, with Kiwis spending more than NZ$6.09 billion online in 2024 even as total retail spending fell, according to NZ Post's 2024 ecommerce insights.
This list groups ecommerce market research tools by the decision they support. It compares data sources, operating level, regional relevance, implementation effort, and limitations. Use it to move from broad market sizing to marketplace, digital shelf, and omnichannel action. If you sell on Etsy, the Etsy competitor analysis guide is also a useful companion for a narrower marketplace question.
Similarweb is a strong first stop when the question is, “How large is this digital category, and who already owns attention?” Its market intelligence spans websites, apps, advertising, search, social, referrals, display, and emerging AI search visibility. For a New Zealand or Australian founder, that creates a useful map before committing to stock, paid media, or a new country.
The platform can compare market and category share across countries and devices, then show how competitors attract visitors. You can inspect channel mix, top destinations, engagement patterns, SEO visibility, AI search prompts, and advertising activity. That makes it useful for testing whether an Australia-first launch has a credible digital audience, or whether a New Zealand category is crowded with offshore retailers.
Its strength is breadth. Similarweb can sit above your analytics account and provide a market view without requiring a pixel installation on every competitor. Self-serve access suits early research, while enterprise data feeds and API access support larger teams that need regular exports.
Practical rule: Treat Similarweb as a directional market map, not as your sales ledger.
The limitation is the same feature that makes the product valuable. Competitor traffic is estimated from a sample and model, so small websites can produce noisy results. Those estimates may differ sharply from first-party analytics. Deep historical views and API access also require higher-level commercial arrangements, which can make the platform a poor fit for a small team with one narrow question.
Use Similarweb when you need to compare digital footprint, channel mix, and category momentum. Pair it with retailer or marketplace data before making a stock or revenue decision. Visit Similarweb for the current product scope.
Semrush is often associated with SEO, but its Traffic and Market products support a wider competitive scan. Market Explorer and Traffic Analytics help teams compare online competitors, audience overlap, acquisition channels, and top pages. That makes it handy for a founder checking whether a category is worth entering, especially when an Australia-first launch could later extend into New Zealand.
The platform moves between two useful levels. Market views show the shape of a category and its major players. Site and page views reveal which pages attract attention, which channels contribute to visits, and where competitors may be building demand. Its connection to Semrush's SEO and advertising tools is practical for teams that already use the wider suite.
The interface is relatively easy to read, so it works well for quick comparisons. You can also set competitor alerts and review historical information, although the depth depends on the chosen access level. For an operator who needs a fast working hypothesis rather than a formal market report, that speed has real value.
Before comparing stores, define the parameters that matter. The competitor analysis parameters guide can help frame factors such as category, geography, channel, product depth, and customer intent.
Traffic figures remain modelled. Small sites can generate unstable readings, and some datasets sit behind higher tiers. Semrush also won't replace point-of-sale data or a retailer's internal sales feed. It tells you where digital activity appears to be concentrated, not what every visitor bought.
Choose Semrush Traffic and Market when you want a quick digital comparison joined to SEO and advertising work. It's a sensible broad signal source for a lean team, provided you label estimates clearly in reports.
Statista fits a different decision. It's less about watching a competitor's daily movement and more about building a credible market narrative for a pitch, business case, or market-entry document. Its repository contains ecommerce statistics, forecasts, consumer behaviour data, and company measures, with useful New Zealand and Australian material across retail, payments, and logistics.
The practical appeal is speed. You can find charts, download data, and export citation-ready material rather than spend hours rebuilding a public report into a slide deck. Statista also offers Excel downloads and custom research through Statista+, which may suit a team that needs a customized evidence pack.
That convenience doesn't make every chart primary research. Statista compiles information from other sources, so the original methodology, date, definition, and geography still matter. A chart labelled “online retail” may not use the same category boundary as your internal sales report. Compare like with like, or the final deck will look neat while mixing different measures behind the scenes.
For New Zealand planning, use a local transaction source alongside a compiled dataset. NZ Post reported NZ$1.5 billion in online spending in the first quarter of 2025, up 7% year over year, and said nearly 30% of annual online spending occurred from October to December, as reported by NZ Post Business IQ. Those figures show why a market estimate needs both a national baseline and seasonal detail.
The market research resource for New Zealand can add regional context when a desk-research project needs local company and technology signals.
Use Statista for baseline evidence, charts, and market-entry context. It's not a substitute for your own customers, retailer feeds, or a first-party panel. It's the research shelf, not the till.
Euromonitor International's Passport is built for a more formal question: how is a retail category structured in a country, and what might shape its next phase? Its country reports and dashboards cover retail ecommerce, category segmentation, company and brand shares, consumer trends, logistics, and regulatory context.
A report such as Retail E-Commerce in New Zealand can give an investor or expansion team a consistent country frame. Historical data, forecasts, competitive shares, and analyst commentary sit together, which is useful when a decision involves more than traffic. A merchant entering Australia may need to understand retail structure, logistics, and category drivers before choosing a channel. Passport is designed for that kind of work.
The trade-off is freshness and cost. Reports update on a cycle, not continuously, so they won't show every sudden price move or assortment change. Access usually involves a single report purchase or a Passport subscription, and the price is aimed at organisations with a serious research budget.
That doesn't make it excessive. It depends on the decision. If you're preparing an investor deck, assessing a country launch, or setting a category plan that will guide several teams, analyst-curated context can prevent a narrow digital view. If you're testing one product listing next month, the expense and slower update cycle may be hard to justify.
Treat forecasts as scenarios rather than promises. Compare them with transaction-derived local data, customer interviews, and your own commercial results. New Zealand's online spending exceeded NZ$12.7 billion in 2025, while online transactions rose 6% and the average basket reached NZ$120, according to NZ Post's Business IQ data. A country report can explain structure, but current local measurements still deserve the final word.
Explore Euromonitor International Passport when the decision needs country depth, category context, and a defensible market narrative.
NIQ is for teams that need a unified view of online and physical retail. Its ecommerce measurement connects retailer data with category, share, pricing, promotion, product content, assortment, and shopper information. In New Zealand and Australia, that omnichannel lens matters because online growth doesn't erase the store. It changes how the two channels interact.
NIQ supports ecommerce category and retailer analysis, digital shelf work, and omnishopper products built from panel and e-receipt data. Grocery and FMCG brands can use that structure to examine where products sell, how price and promotions behave, and which shopper groups move between channels.
The value is harder sales evidence than a traffic estimate. A digital intelligence panel can suggest interest, but retailer and consumer measurement can connect a category question to actual purchases. That helps a brand decide whether a weak online result comes from low demand, poor availability, weak content, or a channel problem.
The operating burden is heavier. Enterprise onboarding, data contracts, governance, and longer lead times are part of the deal. Public pricing is limited, so a small brand should ask about country coverage, retailer coverage, category definitions, data latency, and export rights before signing anything.
The right question isn't only “What's selling online?” It's “Where does the same shopper buy, and what changes between channels?”
NIQ suits larger retailers, manufacturers, and CPG teams that need a shared commercial view. It's not the quickest tool for a solo founder doing early product discovery. Learn more through NIQ's ecommerce measurement and intelligence services.

GfK is a specialist choice for consumer technology, appliances, and other durable goods. Its point-of-sale tracking and Online Sensor products focus on sell-out activity by retailer and channel, including ecommerce. For an electronics brand, that's a different class of evidence from estimated visits or search interest.
GfK can support weekly or monthly analysis of sales, retailer performance, price, promotions, feature mix, and product lifecycle. Its gfknewron and StarTrack portals provide dashboards for teams that need to examine online and offline splits. That split can reveal whether a product is losing demand or shifting between channels.
The vertical focus is the point. GfK isn't a general-purpose tool for every ecommerce category. A fashion merchant or niche beauty brand may find limited relevance, while an appliance manufacturer could gain a much clearer view of retail movement.
Contracts are enterprise-oriented, and public pricing isn't readily available. The buyer should confirm which retailers, categories, time periods, and product definitions are included in Australia and New Zealand. Data that looks “hard” still needs a clear method, especially when products have bundles, variants, or changing specifications.
A useful application is lifecycle planning. If a product is new, heavily promoted, or nearing replacement, price and feature data can help explain performance in a way that broad market traffic can't. It can also show whether an ecommerce campaign lifted the product across the channel or merely shifted demand from stores.
Visit GfK when your decision needs sell-out measurement for tech and durables. For other categories, start with a coverage conversation rather than assuming the same depth applies.

Profitero+ looks at the ecommerce shelf itself. It tracks retailer and marketplace search visibility, share of search, content compliance, price, promotions, availability, ratings, and reviews. For a brand selling through major retailers, the question shifts from “Is the market interesting?” to “Can shoppers find and trust my product where they buy?”
The platform is built around operational cues. A team can monitor what changed, where it changed, and which action may follow. A product may lose visibility because content is incomplete, reviews are weak, price has moved, or stock has disappeared. Those issues require different owners, so the workflow matters as much as the measurement.
Profitero also offers a performance score and integrations that connect shelf signals with sales and media activity. That can help brand teams separate a content problem from a promotional one. It's a useful bridge between research and daily ecommerce operations.
Country and category coverage vary. Before adopting it in New Zealand, confirm that the retailers and marketplaces you care about are tracked at the needed depth. Enterprise-oriented pricing also means this isn't usually a casual subscription for a small merchant.
New Zealand shoppers often research before a major purchase. U.S. Trade data, citing eCommerceDB, reports that approximately 64% of New Zealand online shoppers conduct online research before a major purchase, as described in ShopRank's New Zealand ecommerce store coverage. That makes product information, reviews, and comparison visibility commercial variables, not decorative extras.
The New Zealand ecommerce overview can provide added regional context for teams assessing local digital retail.
Use Profitero+ when the priority is digital shelf execution across retailers and marketplaces.
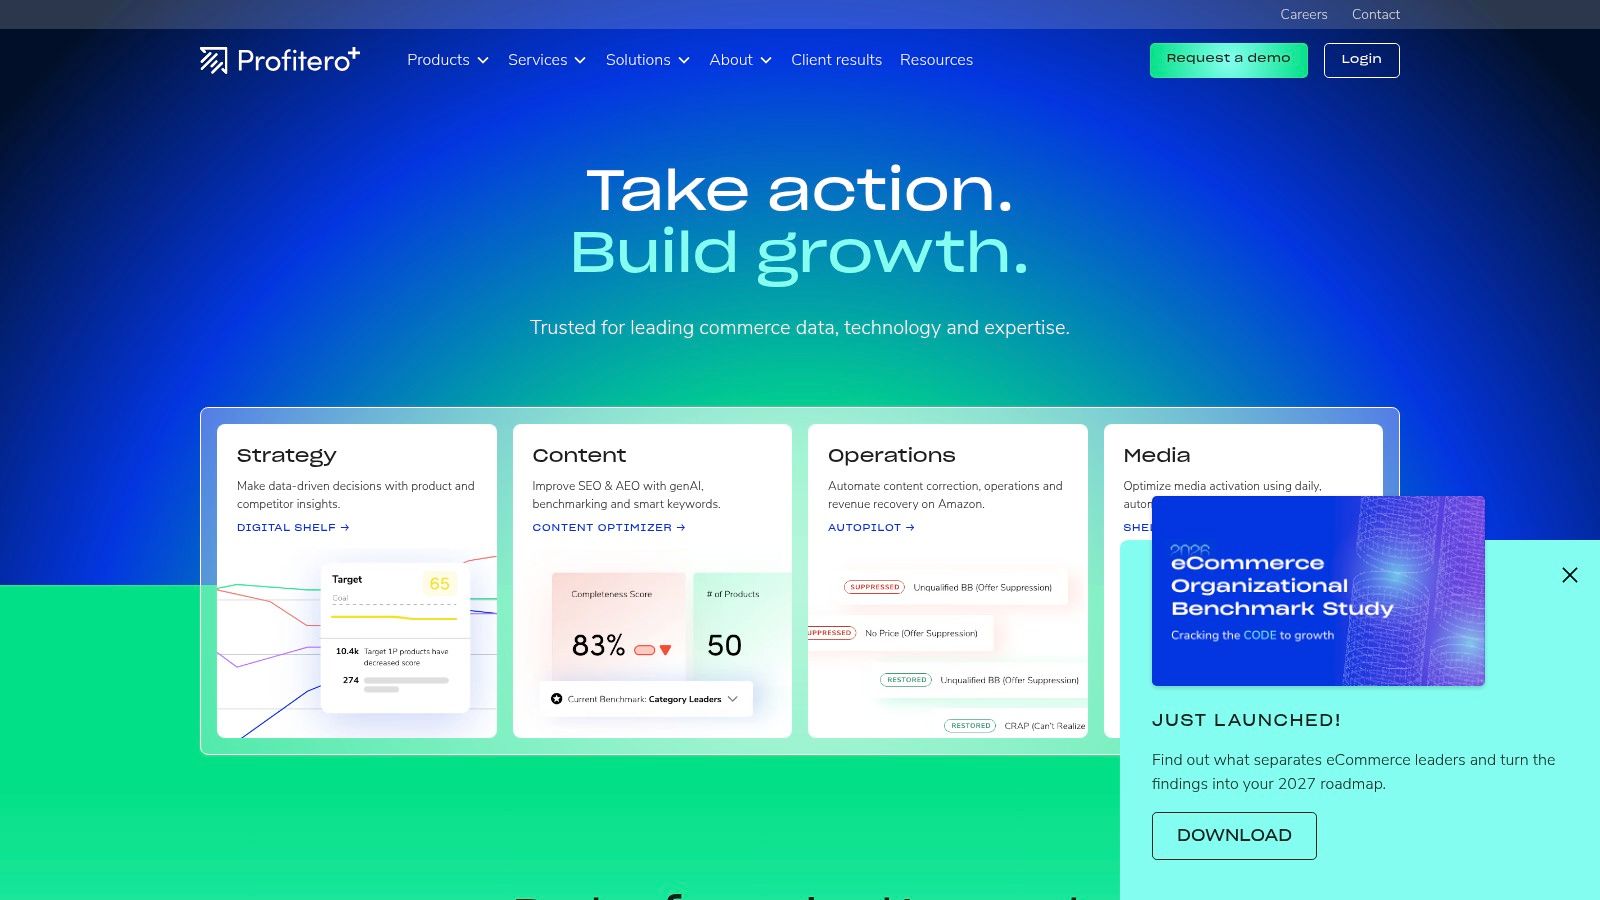
Stackline connects ecommerce intelligence with retail media and demand planning. It combines digital shelf and competitor information with media optimisation, incrementality measurement, and demand and price scenario forecasting. That makes it useful when research must lead directly to a budget or promotion decision.
A brand expanding through Australian marketplaces or large retailers may need to know more than its category position. It may need to decide which products deserve media support, how a promotion could affect demand, and whether a change in visibility appears to produce incremental sales. Stackline is designed around that chain.
Its portfolio planning features can help teams compare products and scenarios. AI-driven forecasting may also support price and demand planning, though any scenario remains dependent on the underlying coverage and assumptions. Ask which retailers, marketplaces, categories, and regions feed the model before treating a forecast as a local truth.
Public pricing isn't listed, so a demo or sales discussion is required. Coverage detail also varies by retailer and region. Those limitations matter for New Zealand merchants, where a tool may offer stronger Australian coverage than local coverage.
Forecasting is useful only when the team can see its assumptions, inputs, and revision history.
Stackline suits a brand with enough media and assortment complexity to need one connected view. It may be too much for a small store that still lacks clean product, sales, and advertising data. Review Stackline for a platform built around market signals, retail media, and scenario planning.
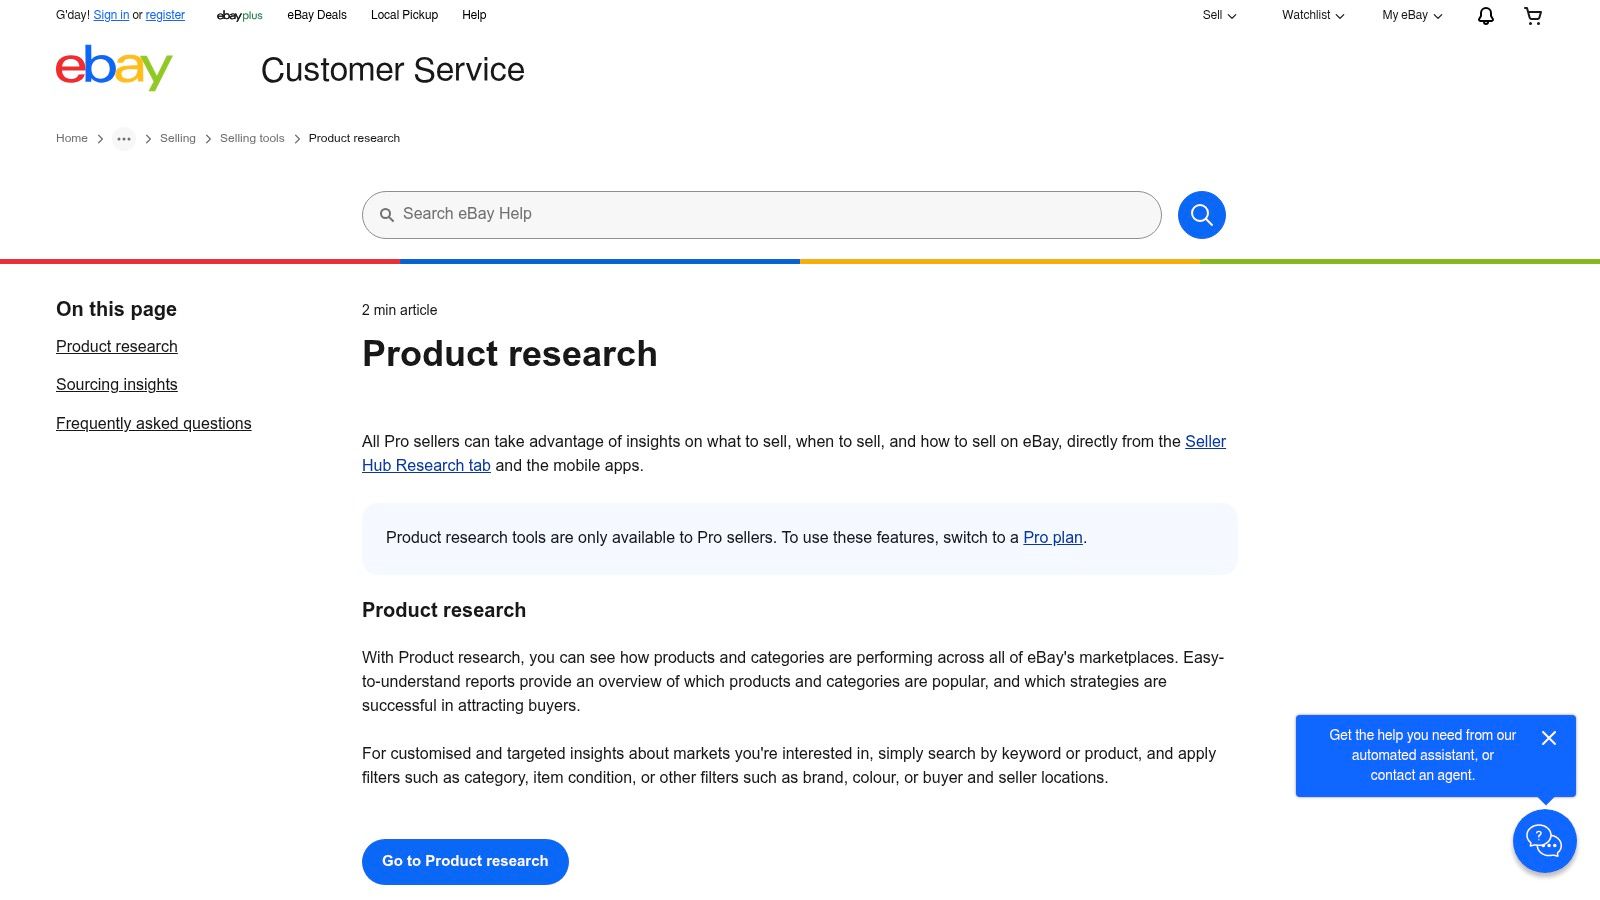
eBay Product Research, formerly Terapeak, answers a narrower question with unusually direct evidence: what sold on eBay, at what price, and with what level of demand? It sits inside eBay Seller Hub and the app, so the data comes from the marketplace rather than a model of the wider web.
The tool provides sales history and pricing for similar items, sell-through, seasonality, and accepted-offer prices. Accepted offers are especially useful because listed prices can flatter a category. The actual transaction price tells you more about what buyers accepted.
eBay's Australian marketplace makes the tool relevant for sellers in the region, including New Zealand operators testing cross-border demand. It can support product selection, listing prices, and decisions about whether a category has enough movement to justify attention.
The boundary is clear. eBay Product Research describes the eBay ecosystem, not all retailers or marketplaces. It won't tell you how a product performs in a supermarket, on Amazon, or through your own store. Its interface may also feel basic beside enterprise suites, but that simplicity is part of its appeal.
Use the data as a marketplace control when another tool produces a broad demand estimate. If Similarweb or Statista suggests interest, eBay's sold listings can test whether buyers transact in a related environment. The two signals answer different questions, and that's precisely why they work together.
Visit eBay Product Research through eBay Seller Hub. It's a practical choice for local pricing, sell-through, and eBay-specific demand research.
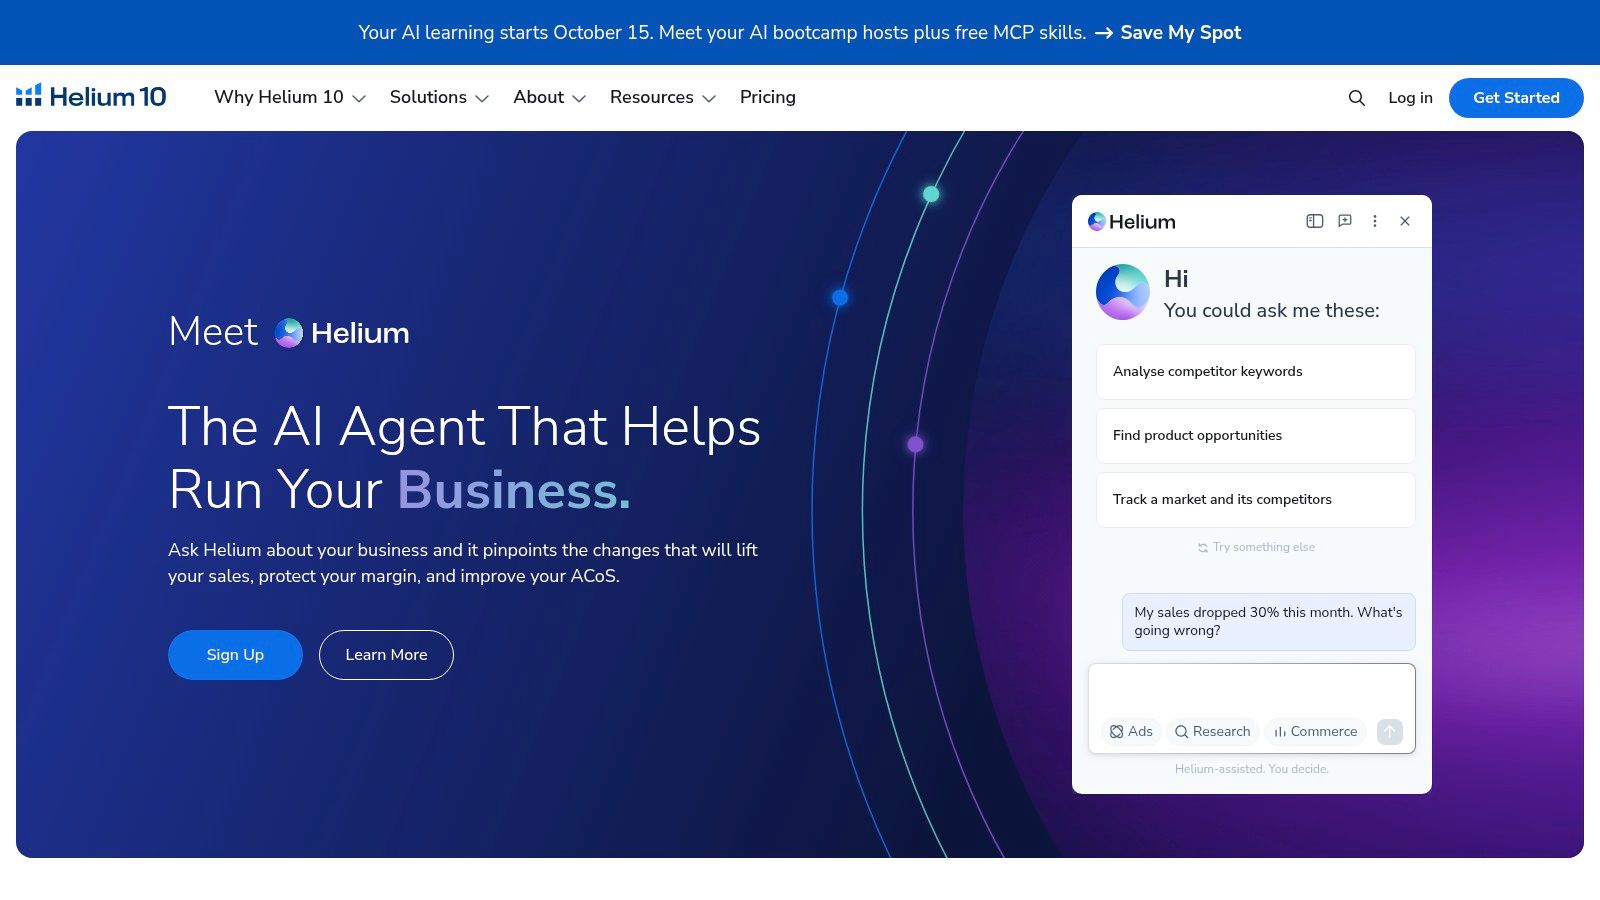
Helium 10 is built for Amazon sellers. Its modules include Black Box, Cerebro, Market Tracker 360, listing checks, keyword research, share-of-voice analysis, and advertising support. For a New Zealand seller targeting Amazon Australia, it offers a more focused operating view than a broad digital market platform.
The suite can support product discovery, keyword analysis, competitor tracking, listing quality checks, and ongoing advertising work. That range is useful for a seller moving from a product idea to an active listing, then watching visibility and retail media performance.
Amazon Australia support is the regional point to verify first. A tool may have broad marketplace functionality, but the usefulness of each module depends on local catalogue coverage, search behaviour, and the marketplace selected. Confirm that the reports you need work for Amazon AU rather than assuming a global view carries over perfectly.
The limitation is also obvious. Helium 10 is Amazon-first, so its value drops for a merchant whose sales depend on Shopify, eBay, department stores, or direct wholesale. The number of modules creates a learning curve, and a small team may need a clear workflow before opening every dashboard.
Use it when Amazon AU is a core channel, not as a general ecommerce market research platform. For sellers comparing alternatives, the Helium 10 alternative guide may help frame the decision.
Explore Helium 10 for Amazon-focused product, keyword, competitor, and advertising research.
| Tool | Core focus | UX / Quality | Value / Price | Target audience | Unique selling point |
|---|---|---|---|---|---|
| Similarweb | Market/category share, traffic & channel mix | ★★★★, broad coverage | 💰 Self‑serve → Enterprise | 👥 Founders, marketers, analysts | ✨ Multi‑channel digital footprint; no pixel needed |
| Semrush (Traffic & Market) | Market Explorer, traffic analytics, top pages | ★★★★, intuitive UI | 💰 Mid‑tier + add‑ons | 👥 SEO/marketing teams, founders | ✨ Integrates with Semrush SEO & ads toolkits |
| Statista | Datasets, charts, forecasts, citations | ★★★★, fast charts & exports | 💰 Subscription & pay‑per‑report | 👥 Researchers, investors, founders | ✨ Extensive ANZ stats with downloadable graphics |
| Euromonitor (Passport) | Country reports, forecasts, brand/category shares | ★★★★, analyst‑led narratives | 💰 Premium reports / Passport subscription | 👥 Investors, market‑entry teams | 🏆 Country‑level analyst insights & multi‑year forecasts |
| NIQ (NielsenIQ) | Omnichannel category/share, e‑receipt & panel data | ★★★★, enterprise‑grade accuracy | 💰 Enterprise contracts | 👥 CPGs, retailers, category managers | 🏆 Trusted grocery/FMCG “currency” for AU/NZ |
| GfK | POS sell‑out, price & promo analytics for durables | ★★★★, regular sell‑out granularity | 💰 Enterprise contracts | 👥 Electronics & appliance brands, retailers | ✨ Hard sales data with clear online vs offline splits |
| Profitero+ | Digital shelf, share‑of‑search, ratings & pricing | ★★★★, brand‑team workflows | 💰 Enterprise‑oriented | 👥 Brand teams, marketplace managers | ✨ Profitero score + deep retailer search visibility |
| Stackline | Digital shelf + retail media + demand forecasting | ★★★★, activation‑focused | 💰 Demo / enterprise pricing | 👥 Brands, retail media & ops teams | ✨ Links market signals to retail media optimization |
| eBay Product Research (Terapeak) | Sold‑price history, sell‑through, seasonality | ★★★, basic UI, accurate data | 💰 Included/low cost via Seller Hub | 👥 eBay sellers, C2C/B2C traders | 🏆 First‑party eBay sales & accepted‑offer comps |
| Helium 10 | Amazon product, keyword & ads intelligence (AU) | ★★★★, deep Amazon tooling | 💰 Subscription tiers | 👥 Amazon sellers, cross‑border merchants | 🏆 Comprehensive Amazon AU modules for listing & ads |
The right tool depends on the decision, not the size of the feature list. If you're sizing a category, comparing digital competitors, or checking whether a launch has visible demand, start with Similarweb or Semrush Traffic and Market. Their estimated traffic and channel views can form a fast working picture, but you should treat the result as directional and check it against your own analytics.
For desk research and market-entry context, Statista and Euromonitor International serve different depths. Statista is useful for finding compiled data and presentation-ready charts. Euromonitor is better suited to a structured country and category narrative, with analyst context and forecasts. Neither replaces local customer evidence or current commercial results.
Enterprise sales measurement calls for NIQ or GfK, depending on the category. NIQ is the broader omnichannel choice, especially for grocery and FMCG. GfK has a sharper focus on technology, appliances, and durables. Both involve more onboarding and governance than a self-serve platform, so the research question should be important enough to justify that effort.
Brands working on retailer execution should look at Profitero+ or Stackline. Profitero+ focuses on digital shelf visibility, content, availability, reviews, and retailer action. Stackline connects shelf and market intelligence to media and demand scenarios. Coverage needs checking in both cases, particularly for New Zealand retailers and marketplaces.
Marketplace sellers can keep the stack narrower. eBay Product Research offers first-party eBay evidence for sold prices and demand. Helium 10 is the more relevant choice when Amazon Australia is central to the plan.
A sensible starting point is one broad signal source and one channel-specific source. Then test the findings against first-party analytics, local customer feedback, retailer evidence, and commercial results. Shopper hesitation may sit at checkout rather than search. EY's research found that expensive shipping was cited by 41% of New Zealand consumers, followed by slow shipping at 20% and poor website experience at 18%, in a study of more than 500 New Zealand consumers, as reported in EY's Future Consumer Index. A demand tool can reveal interest, but it may not reveal why the basket is abandoned.
NZ Apps can also help readers track the broader New Zealand and Australian app and technology environment. Its editorial coverage and directory provide a regional lens for founders and operators comparing software, market signals, and technology companies. For adjacent ecommerce operations, resources such as how Shopify merchants automate customer help can connect research findings to customer-facing workflows.
Choose the smallest stack that answers the next important question. If you're validating a category, don't buy an enterprise shelf suite. If you're already selling through several retailers, don't rely on keyword volume alone. The best research stack is the one that moves a real decision from “maybe” to “test this next.”
NZ Apps covers the New Zealand and Australian app and technology company environment, including ecommerce platforms, SaaS tools, AI products, and practical resources for founders. Visit NZ Apps to find regional market context, company listings, and technology coverage that can support your next ecommerce research decision.
Add your NZ or Australian app or tech company to the NZ Apps directory and get discovered by founders and operators across the region.
Get ListedReach tech decision-makers across New Zealand and Australia. Sponsored and dofollow editorial links, permanent featured listings, and sponsored articles on a DA30+ .co.nz domain.
See Options