
You've got a tidy dashboard, a promising acquisition channel, and a feature request that could keep the product team busy for weeks. The question sounds simple: was the investment worth it? Yet a campaign can produce revenue without producing much cash, while a feature can improve retention without showing a clean sales line straight away.
That's why how to calculate ROI for an app or SaaS business takes more than dropping two figures into a calculator. You need to choose the right return, match the time period, include the full cost, and understand what the result can and can't tell you. The maths is short. The judgement sits around it.
A founder approves a paid campaign, perhaps a product build, and then waits for the numbers to settle. The original decision might have involved a neat investment amount, but the return arrives in pieces. Some customers pay monthly. Some invoices sit unpaid. GST appears in the bank statement but doesn't belong to revenue. Support work grows after launch.
So which answer is right?
The revenue view may say the investment worked. The margin view may look modest once payment fees, hosting, support, and fulfilment are included. The cash view may still be negative because customers haven't paid yet. None of these views is automatically wrong. They answer different questions.
ROI is a capital allocation tool, not a trophy for the highest percentage. It asks whether the value created by an investment exceeds the cost of making it. For a campaign, that might mean incremental contribution margin. For a feature, it could mean added recurring revenue, lower support effort, or stronger retention. For an internal system, the return may come from time saved and fewer manual errors.
ROAS is narrower. It usually compares advertising revenue with advertising spend, so it can look healthy while ignoring salaries, creative work, software, refunds, and delivery costs. Payback period asks a different question again: how long does it take to recover the cash invested?
Practical rule: Don't ask whether an investment has a “good” ROI until you've defined the return and the time window.
Attribution adds another layer. A customer might discover your app through SEO, click a paid ad later, attend a webinar, and then convert from an email. Last-click reporting gives the final touch all the credit, even though earlier activity helped create the sale. New Zealand's digital advertising market makes this harder to ignore. Digital advertising revenue reached NZ$2.967 billion in CY2025 and represented 72.1% of total advertising revenue, according to IAB New Zealand's digital advertising report. Those figures don't tell you which channel deserves credit for an individual customer, but they do show why channel measurement needs care.
For founders in New Zealand and Australia, the useful habit is to calculate more than one view, then use each for its proper decision. Revenue can show demand. Contribution margin can show economic quality. Cash collected can show funding pressure. ROI becomes useful when those measures stop being mixed together.
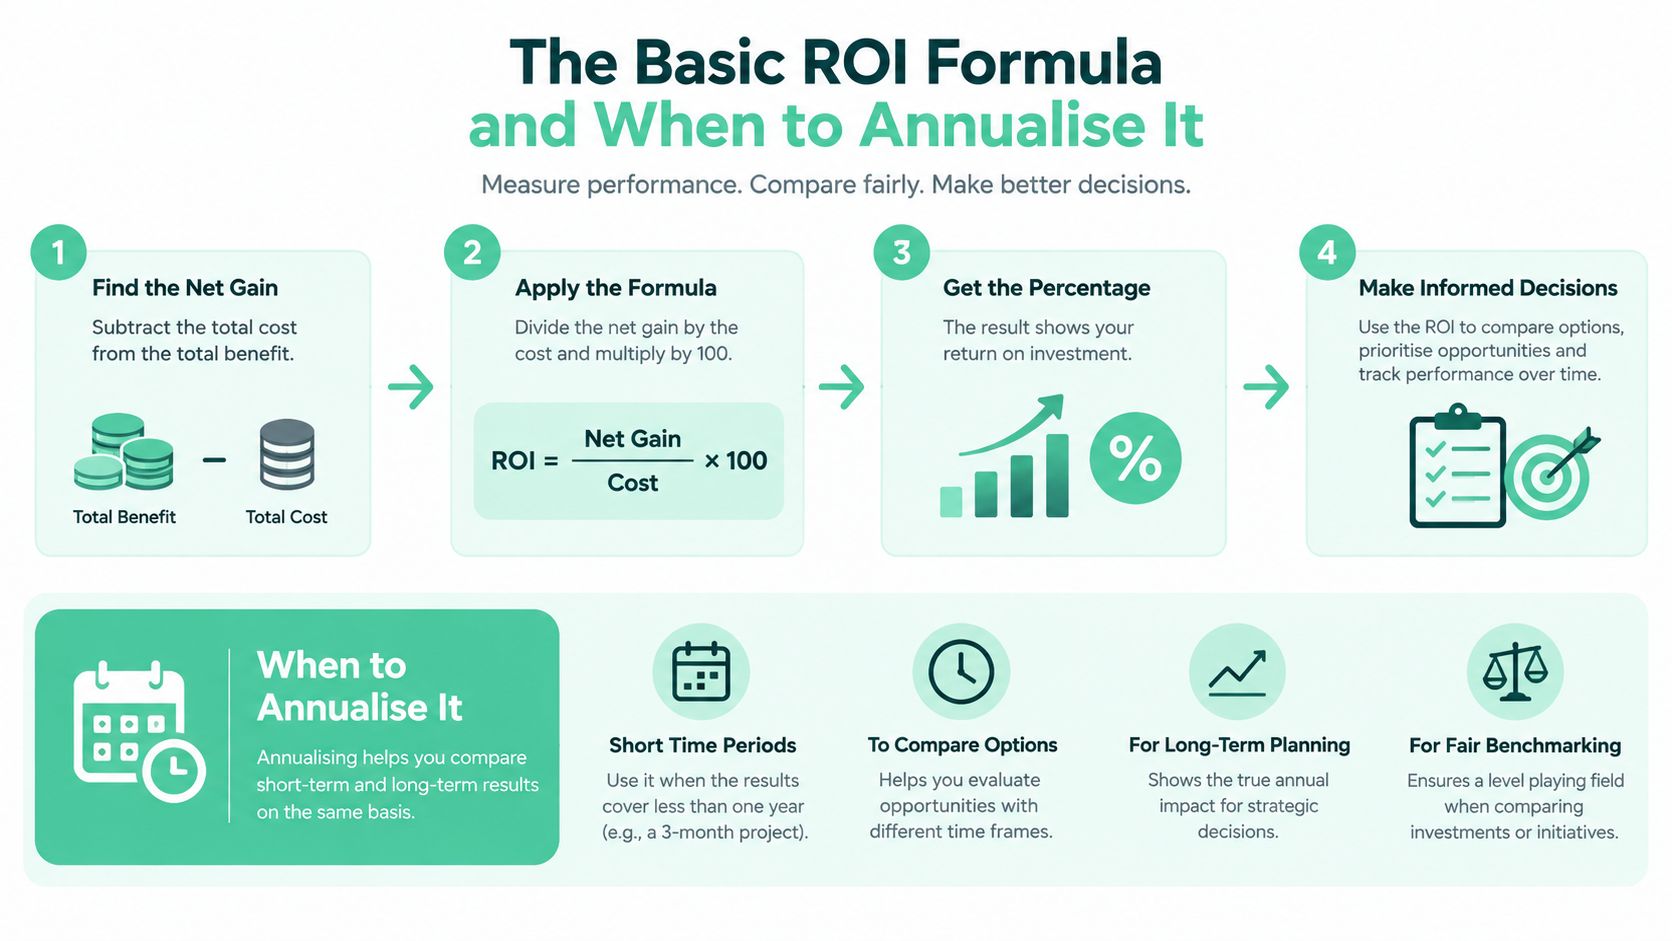
Start with the standard calculation. Take the value you have now, subtract the original investment, divide the result by the original investment, and multiply by 100.
ROI = (Current Value - Original Investment) / Original Investment × 100
The MoneyHub ROI calculator uses the same basic idea. It requires two core inputs, the initial amount invested and the amount returned, then works out the net gain or loss and expresses it as a percentage.
Suppose you spend NZ$2,000 on a small test and the investment produces NZ$2,600 in attributed value. The net gain is NZ$600.
A positive result means the return exceeded the investment. A negative result means the investment hasn't recovered its cost under the model you chose. An ROI of zero means you got the original investment back, but no additional return.
The phrase “current value” can confuse people. It doesn't always mean cash in the bank. It might mean the financial value assigned to additional margin, a customer cohort, or a product improvement. That's why your calculation needs a clear definition before you collect figures.
Here's another quick way to think about it. The denominator, the original investment, is your base. If you leave out staff time or implementation work, the base becomes too small and the percentage looks better than reality. Stats NZ's business data gives founders a useful reminder that business performance depends on more than sales alone. Its annual enterprise survey is described as New Zealand's most source of financial statistics, covering more than 500,000 businesses, while business financial data includes sales, purchases, salaries and wages, and operating profit estimates across industries, as explained by Calculate NZ's business finance guide.
A 30% return over a short period isn't directly comparable with a 30% return over a much longer period. Annualised ROI adjusts the result into a yearly rate, which helps when investments have different holding periods. MoneyHub also provides an annualised view when you enter how long the investment was held.
For a SaaS founder, this matters when comparing a short paid acquisition test with a product build that takes longer to earn back its cost. The raw ROI still matters, but the holding period tells you how long your capital was tied up.
Keep the first calculation plain. State the investment, state the return, show the net gain, then label the period. If you later annualise, record the method and assumptions in the same spreadsheet row. Clear notes prevent a cheerful percentage from wandering away from its context.
The formula stays familiar, but the inputs change with the decision. A campaign asks whether acquisition spend created enough value. A feature asks whether the build produced an economic improvement. LTV and CAC look at the relationship between customer value and acquisition cost over a customer's life.
Assume an NZ app spends NZ$8,000 on paid acquisition. After removing GST from the reporting figures, the team attributes NZ$12,000 in relevant return to that campaign. The net gain is NZ$4,000.
ROI = (NZ$12,000 - NZ$8,000) / NZ$8,000 × 100 = 50%
That result is only useful if the NZ$12,000 represents incremental value rather than every sale touched by the campaign. Include creative production, agency fees, tracking tools, and internal campaign time if those costs belong to the decision. For a clean acquisition model, it also helps to separate CAC, or customer acquisition cost, from total campaign spend. A practical founder's guide to cost per acquisition can help structure that calculation.
Now consider a feature build. The development work costs NZ$30,000, and the team incurs NZ$4,000 in launch support and documentation costs. Over the chosen measurement period, the feature produces NZ$50,000 in incremental contribution value.
Total investment is NZ$34,000. Net gain is NZ$16,000.
ROI = (NZ$50,000 - NZ$34,000) / NZ$34,000 × 100 = 47.1%, rounded to one decimal place.
The word incremental matters. If revenue was already growing at the same pace before the feature launched, assigning the full increase to the feature would inflate the result. Use a sensible baseline, note other releases or campaigns, and keep the measurement period visible. For a broader view of customer economics, founders can also review this customer lifetime value guide.
Suppose a subscription app estimates customer lifetime value at NZ$900 and fully loaded CAC at NZ$300. A simple LTV:CAC ratio is:
LTV:CAC = NZ$900 / NZ$300 = 3:1
If you frame the same inputs as an ROI-style calculation, the net value is NZ$600.
ROI = (NZ$900 - NZ$300) / NZ$300 × 100 = 200%
The ratio and the percentage describe the same inputs in different ways. The ratio is often easier for operating conversations, while ROI makes the gain explicit. Neither tells you how quickly the customer pays back. Churn, refunds, support costs, payment fees, and retention assumptions can change the result sharply.
Here's a compact comparison.
| Scenario | Investment and Return Inputs | ROI Calculation | Result and Interpretation |
|---|---|---|---|
| Paid campaign | NZ$8,000 spend, NZ$12,000 attributed return | (12,000 - 8,000) / 8,000 × 100 | 50% ROI, before any omitted costs or attribution adjustment |
| Feature build | NZ$34,000 total cost, NZ$50,000 incremental contribution value | (50,000 - 34,000) / 34,000 × 100 | 47.1% ROI, based on the selected measurement period |
| Subscription economics | NZ$300 CAC, NZ$900 LTV | (900 - 300) / 300 × 100 | 200% ROI, with an LTV:CAC ratio of 3:1 |
The examples use different return definitions on purpose. Don't force campaign revenue, feature contribution, and customer lifetime value into one reporting bucket. First decide what the investment was meant to achieve. Then choose the return that matches that job.
A campaign can look profitable in one spreadsheet and disappointing in another. The result depends on what you count as the return, when you count it, and whether the figures include GST. For a practical overview of how these choices fit a subscription business, see this guide to SaaS business models.
Gross revenue ROI is the fastest view. It compares the investment with the sales attributed to it, which helps answer, “Did this activity create demand?” It doesn't include the cost of serving those customers, so revenue from a low-margin campaign can make performance look better than it is.
Contribution margin ROI removes the variable costs attached to that revenue. These may include hosting, payment processing, support delivery, fulfilment, and partner commissions. For product-led growth, this often gives a more useful operating view because it asks whether the investment produced value after usage-related costs.
Cash-collected ROI counts the money received during the period. That view fits a founder monitoring runway and funding pressure. Monthly subscriptions, annual prepayments, failed payments, refunds, and invoice timing all affect the result. Deferred revenue needs care too, since cash may arrive before the service is delivered.
GST can skew the comparison. If customer receipts include GST but costs exclude it, the return is overstated. Keep GST separate and use consistent GST-exclusive or GST-inclusive figures throughout. The tax treatment changes both the investment base and the reported return.
Assume a campaign costs NZ$10,000 and generates NZ$18,000 in GST-exclusive customer revenue during the reporting period. Variable delivery costs total NZ$5,000, and NZ$12,000 has been collected so far.
These figures answer different questions. Revenue ROI asks whether the campaign created sales. Contribution margin ROI asks whether those sales created value after variable delivery costs. Cash-collected ROI asks whether the money has returned to the business yet.
For a subscription app, group customers by acquisition month and review each cohort across 6 to 12 months. The right period depends on the decision you're making. A cohort view shows whether early customers repay quickly, whether renewals improve the result, and whether churn weakens the original expectation. It also gives payback a practical context, rather than treating lifetime value as cash already in the bank.
Treasury's CBAx methodology provides a useful discipline for broader ROI analysis. It gives impacts a time profile, a target cohort, and an explicit success rate before discounting them to a common period. A founder doesn't need to copy the full government framework. The useful habit is to state when the benefit should arrive, who receives it, and how likely it is to occur.
Add your NZ or Australian app or tech company to the NZ Apps directory and get discovered by founders and operators across the region.
Get ListedReach tech decision-makers across New Zealand and Australia. Sponsored and dofollow editorial links, permanent featured listings, and sponsored articles on a DA30+ .co.nz domain.
See Options