
The popular advice says to start with TAM, SAM, and SOM, multiply a large global forecast by a plausible share, then drop the result into your pitch deck. For a New Zealand startup, that approach often produces a tidy number and a weak argument. Investors and customers don't fund a spreadsheet. They want evidence that a real buyer has a painful problem, can pay for a solution, and exists in enough markets to support the company you want to build.
A useful market analysis connects local demand, purchasing capacity, sector momentum, competition, and export potential. New Zealand can be small, but it offers a concentrated testing ground. The trick is knowing when local traction proves product-market fit, and when it merely proves that a few friendly early adopters liked the product.
The Silicon Valley sizing playbook assumes that a large home market can carry a company for years. New Zealand founders don't have that luxury. Treating every local customer as part of the final revenue destination can make a product look constrained before it has earned the right to expand.
The better question is not, “How big is New Zealand?” It's, “What can New Zealand help us prove?”
A focused local market can reveal whether buyers understand the problem, whether onboarding works, whether the pricing survives a sales conversation, and whether the product produces a result that customers will mention to someone else. That evidence has value even when the domestic market alone won't support your long-term ambition.
Practical rule: Treat NZ traction as proof of a repeatable customer problem, not automatic proof of Australian demand.
That distinction matters in a pitch. “We can sell to every business in New Zealand” sounds broad but vague. “We solve a defined workflow problem for a specific industry, have tested the sales motion locally, and see the same workflow across Australia” gives an investor something to examine.
MBIE says the Government is prioritising export-focused startups and describes the Elevate fund as supporting early-stage, high-growth companies with global ambitions. Budget 2025 added $100 million to the fund, as reported in MBIE's access to growth capital document. That policy direction doesn't prove demand for your product, but it does reinforce a useful framing for NZ founders: build local evidence with regional economics in mind.
Separate your analysis into two layers:
A niche can be attractive precisely because it is narrow. A small group of buyers may give you sharper feedback than a broad audience with weak urgency. But don't confuse a pleasant pilot with a business model. You need to test whether the problem is common, budgeted, and portable.
The standard top-down model still has a place. Use it as a rough ceiling, not as your central proof. Your main case should run from named customer segments, observed pain, realistic pricing, reachable channels, and expansion logic. That's the version that survives contact with a sceptical VC or a procurement manager.
A bottom-up market size starts with buyers, not a global software forecast. The first job is to define the customer by industry, geography, and type of organisation. “SMEs” is not a useful segment by itself. A sole trader, a regional healthcare provider, and a multi-site construction company may all sit inside that label while having very different needs and budgets.
Stats NZ reported 612,420 economically significant enterprises in New Zealand at February 2024, with 649,160 business locations and 2.5 million paid employees. The figures are available in the Stats NZ business demography release. Those are different units, and your model should keep them separate.
Start with a worksheet that answers four questions:
That last point catches many founders out. 73% of New Zealand enterprises had no paid employees in February 2024, according to Stats NZ. A large enterprise count can therefore exaggerate the number of realistic software buyers if your product needs internal staff, formal procurement, or a recurring budget.
Rental, hiring, and real-estate services represented 21% of all enterprises, while health care and social assistance employed 292,800 people, making it the largest employing industry for the fifth consecutive year, based on the same Stats NZ release. These figures illustrate why industry shape matters. A product for independent property operators needs a different market model from a product sold into staffed healthcare organisations.
Use TAM for every organisation that could benefit in theory. Use SAM for the subset that fits your industry, location, product capability, and buying conditions. Use SOM for the customers you can reach through your actual sales channels during the planning period.
Don't assign every enterprise the same value. Apply different assumptions for:
A good market analysis shows the calculation behind each filter. It also records what you don't know. For primary research, use a short interview or survey rather than a vague “would you use this?” question. The Formbricks guide to market research survey questions is useful when shaping questions about current behaviour, spending, urgency, and switching barriers.
For a New Zealand-specific view of the method, compare your work with NZ Apps' market research guide. Then replace assumptions with evidence from customer conversations, supplier data, trade bodies, and Stats NZ's ICT supply work, which tracks local ICT services and software production, domestic activity, and exports through its ICT supply survey.
A market can be large and still be a poor place to build. It may have slow purchasing cycles, weak technical capability, little export demand, or entrenched suppliers. Market size tells you how many doors exist. Sector momentum tells you whether those doors are likely to keep opening.
NZTech's 2024 metrics put New Zealand's technology sector at NZ$23.8 billion in GDP contribution, equal to 8% of the national economy, and NZ$11.4 billion in technology goods and services exports. NZTech describes technology as the country's third-largest export earner, behind dairy and tourism, in its 2024 technology-sector metrics.
That doesn't mean every app belongs in a healthy category. It does show why export evidence deserves a place beside domestic demand.
Track a handful of signals rather than chasing one exciting headline:
NZTech reported 119,520 technology workers in 2024, representing 4.8% of the national workforce, and technology companies invested NZ$1.15 billion in research and development, nearly 29% of national business R&D. The report also recorded NZ$467 million across 146 startup deals. Together, those indicators describe an ecosystem with technical depth, research activity, and investor interest. They don't remove the need for customer proof.
Software exports had grown at an average annual rate of 22% over the preceding decade, according to NZTech. That's a historical indicator, not a promise about your category. Use it to ask better questions: is your product part of a durable export pattern, or is it riding a short burst of attention?
The useful distinction: A popular category attracts conversation. A durable category attracts buyers, skilled people, R&D, exports, and repeat investment.
A category review should also include local supply data. Stats NZ's ICT work helps you compare the number of potential customers with the revenue and service mix of businesses already supplying software and ICT services. This can expose a gap between a large theoretical market and a small practical buying category.
Tools can speed up research, especially when you're compiling company lists, firmographic records, and signals from multiple sources. If you're assessing enrichment workflows for an AI research process, this checklist of best enrichment tools for AI agents gives you a way to compare the options.
The tool is not the analysis. A clean list of companies still needs human judgement. Check whether each business has the workflow, budget, authority, and urgency your product requires. Then show how local demand connects to a broader market with similar conditions.
AI policy creates useful context, but it doesn't make a customer ready to buy. MBIE reports that New Zealand launched its first AI Strategy and Responsible AI Guidance for Business, estimates that AI could add $76 billion to GDP by 2038, and committed up to $70 million over seven years for AI research and applications. Those figures describe policy momentum and a projection, not a purchase order from a mid-sized logistics company in Hamilton.
The local evidence base also has a gap. Stats NZ paused the Business Operations Survey in 2024 and 2025, with a new 2026 survey adding questions on AI use and impact, as noted in MBIE's innovation, technology, and science information. That makes it risky to treat a single adoption estimate, search trend, or international forecast as a reliable picture of New Zealand demand.
MBIE found that 51% of businesses believed they would benefit from using more digital tools or becoming more visible online. Among businesses using digital tools for external purposes, 56% said those tools helped generate current revenue, turnover, or sales, according to MBIE's digital capability research.
That evidence points to a practical research sequence:
The barriers matter as much as the interest. MBIE identified affordability, skills, tool selection, and uncertainty about return on investment as barriers to further digital adoption. Your pricing, setup process, training, and sales message should answer those concerns directly.
A buyer may like the idea of AI and still reject your product because the data is messy, the workflow is sensitive, or no one can govern the output. Test:
For demand planning, founders can consult Fundl's forecasting guide alongside direct customer research. For a practical validation sequence for apps, see NZ Apps' guide to validating a startup idea. Search interest may help you form a hypothesis. Only customer behaviour can confirm whether the hypothesis has legs.
A crowded category isn't automatically bad. It may show that customers already understand the problem and that money changes hands. The danger is reading a large funding headline as proof that new entrants have easy access to capital.
University of Auckland research reported that total startup capital invested rose 61% in 2025, while early-expansion and expansion rounds represented 49% of funding rounds and received 83% of invested capital. The University of Auckland report on startup support also shows why the headline needs context. Capital can concentrate in companies that have already reached a later stage.
Map competitors by more than product category. Record their target segment, pricing approach, distribution, funding stage, customer proof, integrations, and geographic reach. Then place the market signals beside the funding signals.
| Funding Stage | Capital Share | Market Signal | Founder Opportunity |
|---|---|---|---|
| Proof of concept | Smaller share of total investment | Investors may want stronger evidence before committing | Solve a narrow pain and show paid usage |
| Early expansion | Meaningful share of funding activity | Some companies have moved beyond initial validation | Compete through a clear segment, channel, or implementation edge |
| Expansion | Largest share of invested capital | Later-stage businesses are attracting concentrated capital | Find underserved customers or infrastructure gaps rather than copying the leader |
The table isn't a substitute for research. It helps prevent a common mistake: assuming that a well-funded competitor has solved the whole market. They may serve larger customers, charge more than smaller firms can afford, or avoid a messy segment that you can handle well.
A useful competitor review asks:
Use NZ Apps' competitive analysis resource as a prompt for structuring the review, then verify each claim through product pages, customer conversations, pricing material, job listings, public announcements, and direct demos.
Funding is a signal about investor conviction. It is not a proxy for customer urgency.
Your opportunity may be a cheaper entry point, a specialised workflow, a partner-led route to market, or software that helps another company reach repeatable revenue. The strongest whitespace often looks unglamorous at first. That's fine. Boring pain pays bills.
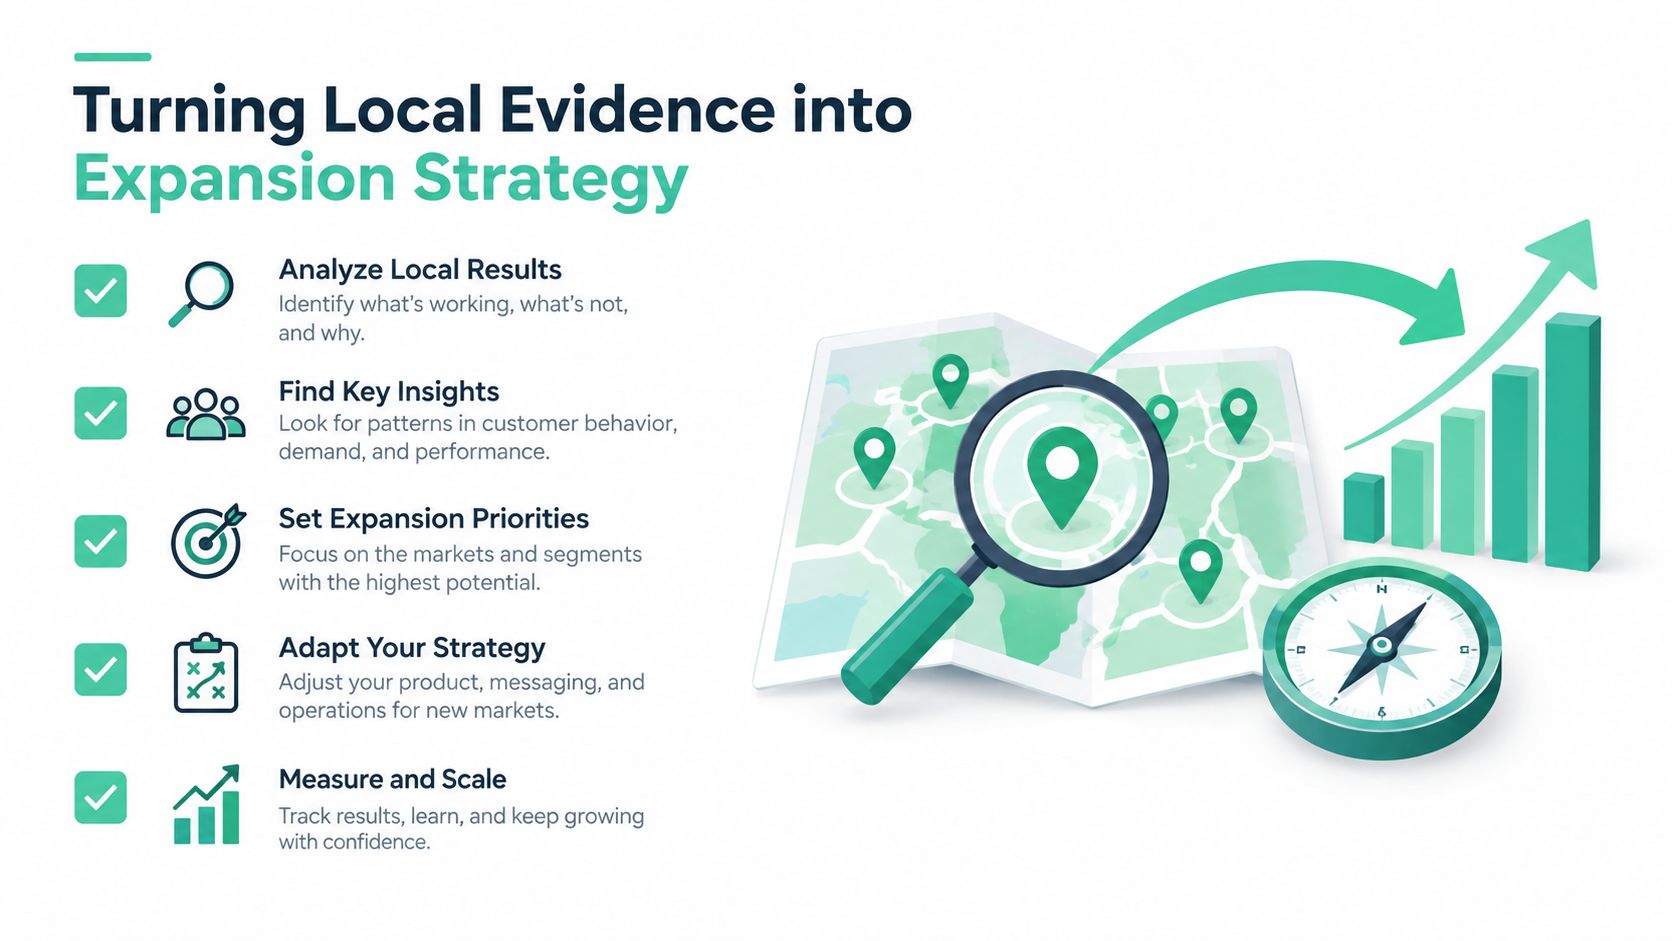
Research becomes useful when it changes a decision. By this point, you should be able to state who buys, what problem they have, how they solve it now, why your product fits, and what evidence would justify moving into Australia or another market.
The final test is not whether the market looks exciting. It's whether the evidence forms a chain:
defined segment → urgent problem → reachable buyer → paid use → repeatable result → transferable demand
Create one row for New Zealand and one for each proposed expansion market. Score each market qualitatively against the same questions:
Don't hide uncertainty inside a single score. Write the assumption beside it. A market with high potential and low evidence should receive a test budget, not a full launch.
Australia is close, but close doesn't mean identical. Model the cross-border route before you celebrate local traction. Compare acquisition costs by channel, expected sales time, implementation effort, support load, and realistic pricing. A customer who buys after one local introduction may not represent the cost of reaching an equivalent buyer in Melbourne or Brisbane.
Use local evidence to define expansion gates:
The contrarian point is worth keeping: a niche New Zealand market may be too small for your final revenue target and still be the right place to start. It can give you a controlled setting for testing the product, pricing, messaging, and sales process. But local proof must earn its way into the regional plan.
A convincing investor memo should show the numbers, but it should also explain the decisions behind them. Include:
Avoid a heroic forecast that assumes every step goes well. A thoughtful downside case earns more trust than a giant market slide with no route to the first hundred customers.
A strong market analysis is a working document, not a ceremonial PDF. Update it when buyers reject the price, when a competitor changes its offer, when a new regulation affects delivery, or when a pilot exposes a flaw. The job is to reduce uncertainty enough to make a sound next move.
NZ Apps covers the NZ and AU app and technology sector through market analysis, company directories, funding and growth guides, and practical resources for founders and operators. Visit NZ Apps to research regional companies, assess categories, and build a more grounded market case for your next product or expansion move.
Add your NZ or Australian app or tech company to the NZ Apps directory and get discovered by founders and operators across the region.
Get ListedReach tech decision-makers across New Zealand and Australia. Sponsored and dofollow editorial links, permanent featured listings, and sponsored articles on a DA30+ .co.nz domain.
See Options