
The popular advice is to pick the most advanced algorithm you can afford, feed it more data, and wait for the magic. That advice makes for tidy conference slides. It also sends plenty of NZ startups down expensive rabbit holes.
Predictive analytics models succeed or fail long before the algorithm becomes interesting. If customer records are incomplete, labels are unreliable, and nobody owns the decision that follows a forecast, a complex model only produces polished uncertainty. A plain regression model with clean inputs can be more useful than a neural network built on digital porridge.
For NZ SaaS founders, the practical question isn't “Which model is smartest?” It's “What decision will this prediction improve, and what evidence proves it works?” That shifts the conversation from AI theatre to data quality, validation, governance, and daily use.
Predictive analytics models are pattern-matching tools. They use historical data to estimate what is more likely to happen next, whether that is customer churn, demand shifts, transaction risk, or which queue deserves attention first. Useful, yes. Magical, no.
That matters because a prediction is a probability, not a finding about any one person. A model can flag a group with a higher estimated risk of long-term unemployment. It cannot prove that a specific individual will end up there. Once the output affects support, credit, hiring, healthcare, or public services, human judgement has to stay in the loop.
New Zealand public agencies have been using predictive methods in operations and policy work for more than a decade. The Algorithm Assessment Report describes how Stats NZ manages the Integrated Data Infrastructure and Longitudinal Business Database as large de-identified research systems. Those systems bring together information from government agencies and non-government organisations about people, households, and businesses. For founders, the lesson is straightforward. The hard part is rarely finding an algorithm. The hard part is getting data that is joined, labelled, governed, and fit for a real decision.
In practice, these models are often used to sort limited attention. Agencies use them for statistical modelling, forecasting, intervention assessment, and policy evaluation. One documented example is the Ministry of Social Development using predictive modelling to identify school leavers who might face a higher risk of long-term unemployment, then using that signal to inform what support could fit.
That is the right mental model for SaaS teams as well. Prediction helps a team rank, prioritise, and review. It does not replace the decision-maker. A customer success platform might score accounts by churn risk. A finance workflow might flag unusual payment behaviour. An ops team might forecast demand so staffing is less reactive. In each case, the model narrows the queue and a person decides what to do next.
Practical rule: Treat a prediction as a useful signal, not a verdict.
The same principle shows up in many machine learning applications for business. The model matters less than the workflow wrapped around it. Who owns the alert? What action follows a high-risk score? When is the prediction reviewed? How does the team capture feedback when the model gets it wrong? If those answers are fuzzy, the model usually ends up as dashboard furniture.
Historical data carries the fingerprints of old processes. If support complaints were only logged for customers persistent enough to complain, the model learns a skewed view of dissatisfaction. If service labels were applied inconsistently, the inconsistency gets repeated at speed.
A model can still be useful in that messy reality, but only if the team is honest about what it knows and what it does not. Human outcomes depend on timing, context, incentives, and missing variables that never make it into the dataset. Good teams build predictions to support a decision, keep a person close to the consequence, and prove baseline value before they spend months chasing a fancier model.
Algorithm selection starts with the business question, not the model catalogue. Asking “Should we use a random forest?” before defining the decision is like buying a set of kitchen knives before deciding whether dinner is soup.
New Zealand's Algorithm Charter presents predictive analytics as a spectrum. Regression models and decision trees are comparatively simple and can support prediction or process improvement. Neural networks and Bayesian models perform more complex calculations and may capture richer patterns, but they can also demand more explanation, monitoring, and governance.
| Business question | Useful model family | What the output looks like |
|---|---|---|
| Will this account churn? | Classification | A class or risk score |
| How much stock will we need? | Regression or time series | A numeric forecast |
| Which users behave alike? | Clustering | Groups without preset labels |
| Which event looks unusual? | Outlier detection | An anomaly signal |
| What will happen next quarter? | Time-series forecasting | A forecast by time period |
Classification suits a decision with defined categories, such as likely to renew, likely to churn, or needs review. It works well when the label is clear and the cost of each error is understood.
Regression estimates a number. Revenue, demand, handling time, and usage volume fit this shape. A regression model won't tell a sales team whether an account is “good” or “bad”. It might estimate the expected value of a measurable outcome.
Time-series models care about sequence. The order of observations matters, and publication timing matters too. A forecast trained with information that wasn't available at the time of the original decision will look clever for the wrong reason.
Clustering helps when no reliable label exists. It can reveal groups of users with similar behaviour, but someone still has to decide whether those groups are commercially useful or merely mathematically neat.
Decision trees are often easier to explain to a board, customer, or regulator than a dense neural network. That doesn't make them old-fashioned. It makes them useful when a person needs to understand why a case was flagged.
For more domain-specific examples, Forge Reliability's predictive maintenance guide is a useful reference point. Maintenance models typically connect sensor patterns to an operational decision, such as inspecting equipment or scheduling work. The same design principle applies to SaaS: define the signal, define the action, and define what happens when the signal is wrong.
Fancy methods have their place. They can capture nonlinear relationships and interactions that simpler approaches miss. But complexity adds more than computation. It adds documentation, testing, drift monitoring, explanation work, and a larger surface for failure.
Choose the least complicated model that clears your business threshold. Then earn the right to add complexity.
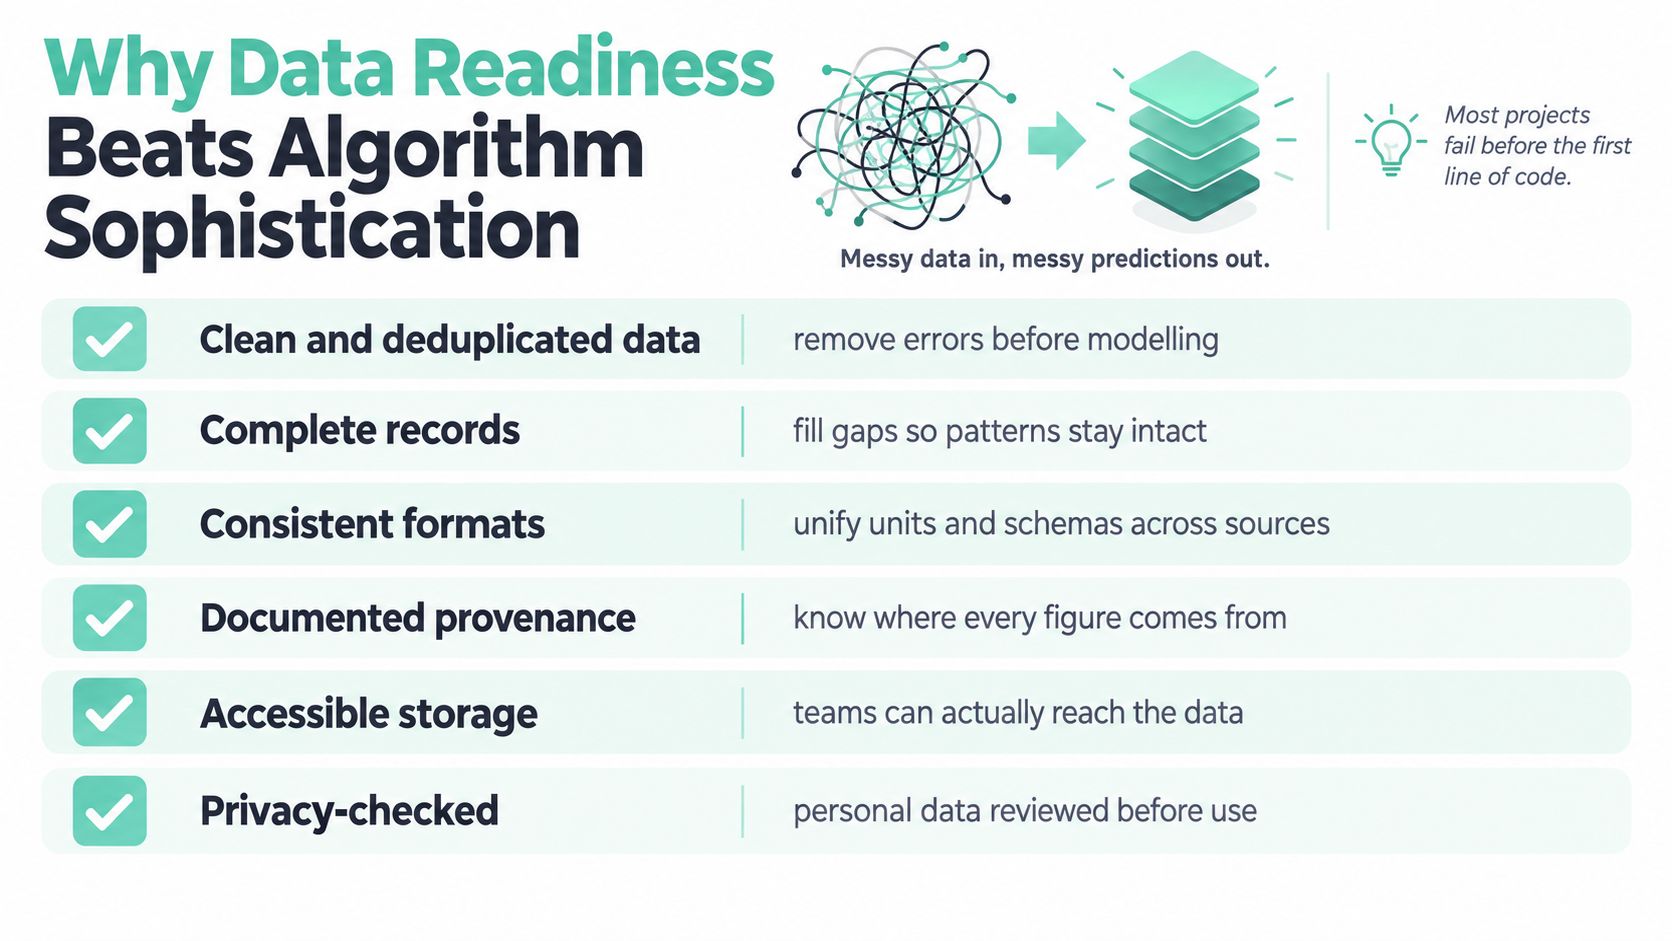
Many predictive projects fail before the first line of code. The dataset contains duplicate accounts, missing dates, shifting field definitions, and labels that different teams apply in different ways. A model cannot repair a broken measurement system by staring at it harder.
Datacom reported that 30% of surveyed New Zealand businesses said half or less of their data was free from issues in its research on preparing for 2025. The same source reported that AI use among larger organisations reached 87% in 2025, up from 66% in 2024. Those figures sit beside a blunt operational reality: organisations can adopt AI while still struggling to trust the data underneath it. Datacom's research makes that gap hard to ignore.
Before model training, ask:
That final question gets missed. A model may produce a tidy ranked list, but a support team can only review so many accounts. If the business can't respond, the forecast becomes dashboard decoration.
A simple baseline gives you a reality check. For a numeric forecast, that could be a basic historical average or an autoregressive model. For classification, it could be a straightforward statistical model. If the complex approach doesn't beat the baseline on data it hasn't seen, its sophistication is mostly theatre.
Cleaning data isn't free. Neither is delaying a launch. Start with the fields that affect the decision most, document their weaknesses, and run a small pilot with a clear threshold for useful performance.
A good pilot might track false-positive cost, forecast error, review time, or the share of recommendations a team can act on. It should also record what happens after intervention. A model that predicts risk accurately but produces no better business action may not deserve production status.
For teams choosing business intelligence tools for operational decisions, the same test applies. A dashboard can describe what happened. Predictive analytics models add a forecast, but the forecast only earns its place when the data and workflow can support it.
A training score is not evidence that a model is ready. The model has already seen that data, so the result tells you how well it remembered the past. Production brings new customers, new seasons, changed behaviour, missing fields, and the occasional spreadsheet that arrives with a column renamed for no obvious reason.
Start with a holdout design that matches how the product will operate. For time-dependent data, use rolling or expanding windows. Train on the earlier period, test on the next period, then move the window forward. This preserves the information available at each forecast point and reduces leakage.
The Reserve Bank of New Zealand's study of macroeconomic nowcasting used rolling, real-time validation from 2009 Q1 through 2018 Q1, with approximately 550 New Zealand and international macroeconomic indicators. Most machine-learning models produced lower RMSE and mean absolute deviation than an autoregressive benchmark, while boosted trees, support-vector-machine regression, and neural networks reduced average forecast errors by approximately 20–23%. The findings are detailed in this Reserve Bank study published through the BIS.
Accuracy can hide class imbalance. If almost every case belongs to one class, a model can appear accurate while missing the cases your team cares about.
Use the metric that fits the decision:
The right choice depends on the cost of mistakes. A fraud screen may favour recall when missed cases are costly, but a small support team may need higher precision to avoid wasting scarce review time. Don't report one flattering number and call the problem solved.
External validation matters when you can obtain a separate dataset. A NZ infrastructure procurement study used 2,276 NZ infrastructure pipeline projects and compared ensemble methods. Its validation accuracy was 92.58% for Random Forest, 92.25% for XGBoost, and 91.92% for LightGBM. On an external dataset, the reported accuracy was 95.82%, with precision of 0.9181, recall of 0.9582, and F1 of 0.9377, according to the infrastructure procurement research.
Those figures don't mean every project should use an ensemble. They show why external testing and several metrics matter. They also point to a nasty trap: exclude features that only become available after the procurement decision. Leakage can make a model look brilliant until deployment removes the illicit clue.
Report results by forecast horizon, customer segment, and important operating conditions. Give customers a plain-English explanation of what the model uses, what it misses, and when a human should override it. Production readiness is not a score. It's a body of evidence.
Human wellbeing is a useful test because it refuses to behave like a clean sales funnel. A 2025 New Zealand study used approximately 10,000 respondents from the New Zealand General Social Survey, linked with census-level administrative variables from the Integrated Data Infrastructure. Researchers predicted life satisfaction, life worthwhileness, family wellbeing, and mental wellbeing using stepwise linear regression, Elastic Net regression, and Random Forest.
Random Forest generally produced the strongest predictive performance, with RMSE values of approximately 1.5, but the models had low R² values. In plain language, the models could generate useful predictions while explaining only a limited share of the variation in wellbeing. The findings appear in the Scientific Reports study on New Zealand wellbeing prediction.
That distinction is gold for product teams. A model doesn't need to explain every cause to help prioritise a service, but the team must understand what its output can and cannot support. Administrative variables can add signal, yet they won't capture every personal, social, and contextual factor.
Now shift from people to the economy. The Reserve Bank work described earlier found that high-dimensional models could use nonlinear relationships and leading indicators that a univariate autoregressive model could not capture. For a SaaS operator, that suggests combining product telemetry with external variables such as business confidence, employment, exchange rates, or sector activity, provided the publication timing is preserved.
A churn model that only watches logins may miss an industry slowdown. A demand forecast that ignores employment or sector activity may mistake a market shock for a product problem. Broader signals can sharpen the picture, but they also create more missing-data and timing risks.
The NZ infrastructure procurement research offers a more concrete categorical decision. Its models predicted procurement methods from domain-specific project data, and the external results showed strong precision, recall, and F1 alongside accuracy. The lesson is not that procurement is easy. It is that a narrow target, carefully defined features, and external validation can produce a model that supports a real operational choice.
Insurance offers another natural use case, particularly transaction and claims review. The AI for Insurance fraud detection database is a useful place to compare fraud signals and workflows before designing a product feature. For NZ and Australian founders, the core pattern remains the same: combine relevant internal history with carefully governed external context, then give a trained person the final say where the consequences are serious.
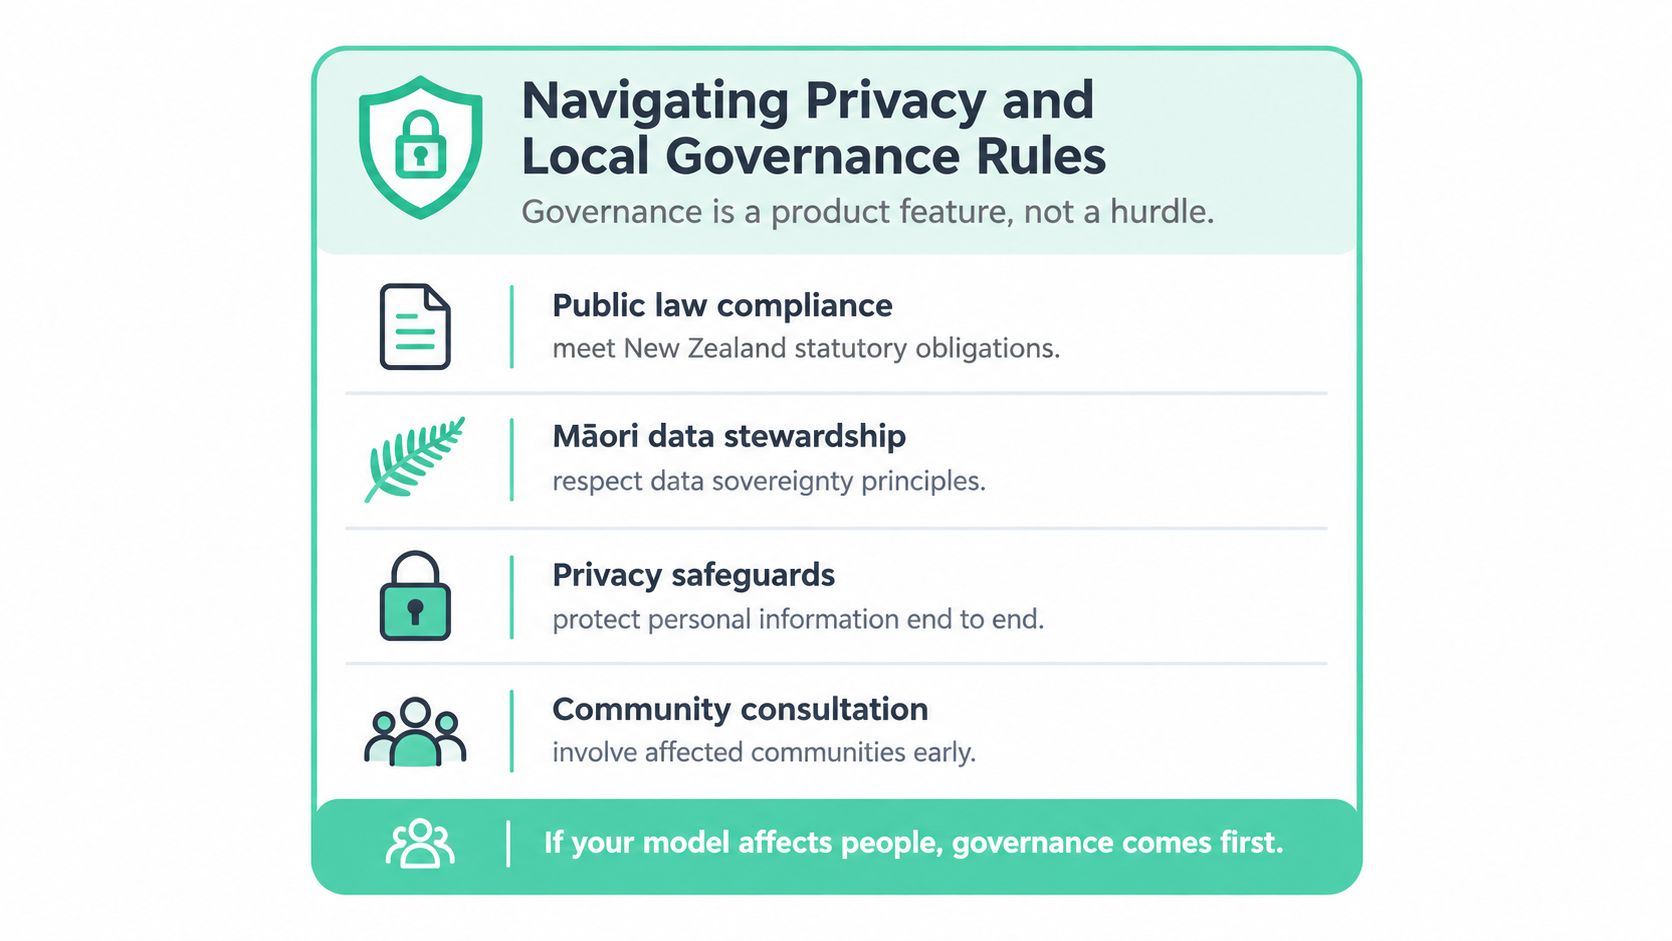
Governance isn't a compliance appendix. If a model affects people, governance is part of the product interface, the operating process, and the sales conversation.
The Office of the Privacy Commissioner recommends privacy impact assessments, transparency about how and why AI is used, procedures that support accuracy and individual access, and human review before acting on outputs. Its guidance also calls for engagement with Māori about risks to taonga information, as set out in the Privacy Commissioner's AI and Information Privacy Principles guidance.
New Zealand's Algorithm Charter was released in July 2020 and contains six commitments covering transparency, privacy, bias, data quality, human oversight, and the principles of the Treaty of Waitangi, according to algorithm charter information published by Inland Revenue.
For a SaaS team, turn those commitments into a model-impact record:
MBIE's Algorithm Use Policy applies to algorithms that make or assist with decisions and receive a Medium risk rating or higher under its Risk Management Framework. It defines algorithms as computer-based decision processes that identify patterns, assess whether cases match criteria, or predict outcomes.
A model can be statistically strong and still produce unacceptable outcomes if Māori communities are under-represented in the training data, if a target variable acts as a proxy for disadvantage, or if people can't challenge a decision. Consultation should happen early, before the product has hardened around a questionable assumption.
Founders also need a named decision owner. If a model recommends denying service, escalating a case, or changing a customer's treatment, the vendor cannot hide behind the software. The customer may own the final decision, but the product team still owns the quality of its documentation, controls, and warnings.
Teams building trust into their products can also review a practical data privacy page from Artul.ai for ideas about communicating privacy controls clearly. For NZ-specific obligations, the Privacy Act guidance for New Zealand businesses offers a useful local starting point. Neither replaces legal advice, a privacy impact assessment, or engagement with affected communities.
A model becomes useful when it enters a routine. Someone checks the output, someone acts, someone records what happened, and someone reviews whether the signal still deserves trust. Without that loop, even a strong forecast becomes shelfware.
Datacom's 2026 survey reported that 91% of New Zealand organisations used some form of artificial intelligence, up from 87% in 2025 and 66% in 2024. Yet only 15% said they had scaled AI across the organisation, and just 4% used it to transform core operations, down from 8% the previous year, according to Datacom's 2026 State of AI Index.
The gap is not a shortage of models. It is a shortage of owned workflows.
Start with one decision. “Predict churn” is too broad. “Give the customer success lead a weekly list of accounts worth reviewing, with reasons and a recorded outcome” is workable.
Then assign the operating pieces:
Keep the first version small. A spreadsheet experiment can expose missing fields and odd labels faster than a grand platform project. Once the team trusts the decision and the measurement, automate the reliable parts.
NZ Apps describes systems that analyse sales and operational data to identify trends, anticipate customer needs, and inform inventory or service decisions. It also provides AI model development and training covering algorithm selection, training, validation, testing, performance optimisation, and refinement. That makes it one possible local option for a founder who needs help moving from an early data experiment to a working predictive analytics process.
The finished product isn't the model. It's the habit around the model. Make one forecast useful, explainable, and repeatable before adding another.
NZ Apps helps NZ and Australian businesses assess, develop, validate, and refine predictive analytics systems for sales, operations, customer needs, inventory, and service decisions. If you're ready to test a real use case rather than buy another impressive demo, visit NZ Apps and discuss the decision you want your data to improve.
Add your NZ or Australian app or tech company to the NZ Apps directory and get discovered by founders and operators across the region.
Get ListedReach tech decision-makers across New Zealand and Australia. Sponsored and dofollow editorial links, permanent featured listings, and sponsored articles on a DA30+ .co.nz domain.
See Options