
Database optimization is the systematic improvement of how a database stores, retrieves, joins, and processes data so queries use fewer resources and return faster, without changing the correctness of the results.
For a founder, that means less waiting on a dashboard and less money spent doing work the app never needed. If your product still does the same job but feels slower each month, you don't necessarily need a bigger server. You need to find out where the effort goes.
You open the customer dashboard before a call. It used to snap into view. Now you watch a loading wheel while support messages mention timeouts, and the database line on your cloud invoice has crept up.
Your team hasn't changed the product logic. Customers still sign in, view their records, and run reports. Yet the same actions seem to need more patience and more infrastructure.
Is the database slow, or is the shape of the work wasteful?

Think of a café where staff search every cupboard whenever someone orders a flat white. Hiring another person might shorten the queue, but putting the cups beside the machine tackles the needless work.
Database tuning follows that logic. Your team looks for wasted CPU time, memory, disk reads, and network trips. The result must stay correct, including which customer records each person can see.
Practical rule: A faster wrong answer isn't an improvement.
Buying more capacity can be sensible during an incident. Treat it as breathing room, though, rather than proof that you've fixed the cause.
The distinction starts with design. The University of Canterbury's database course outline treats physical schema design for performance as a skill alongside SQL and logical modelling. A structure that feels comfortable with thousands of customer records may behave quite differently when events and audit logs reach millions.
Name what hurts before naming a fix: opening a customer account, settling a payment, or loading a report. That keeps the investigation tied to something people need.
For banking-related products, Visbanking's company database strategies for banks offers a domain-specific resource to consider alongside your technical review. Keep the business requirements close, especially when customer access and reporting share the same data.
The useful question isn't whether a schema looks tidy. It's whether your team can serve the same correct result with less work, at a cost you can sustain.
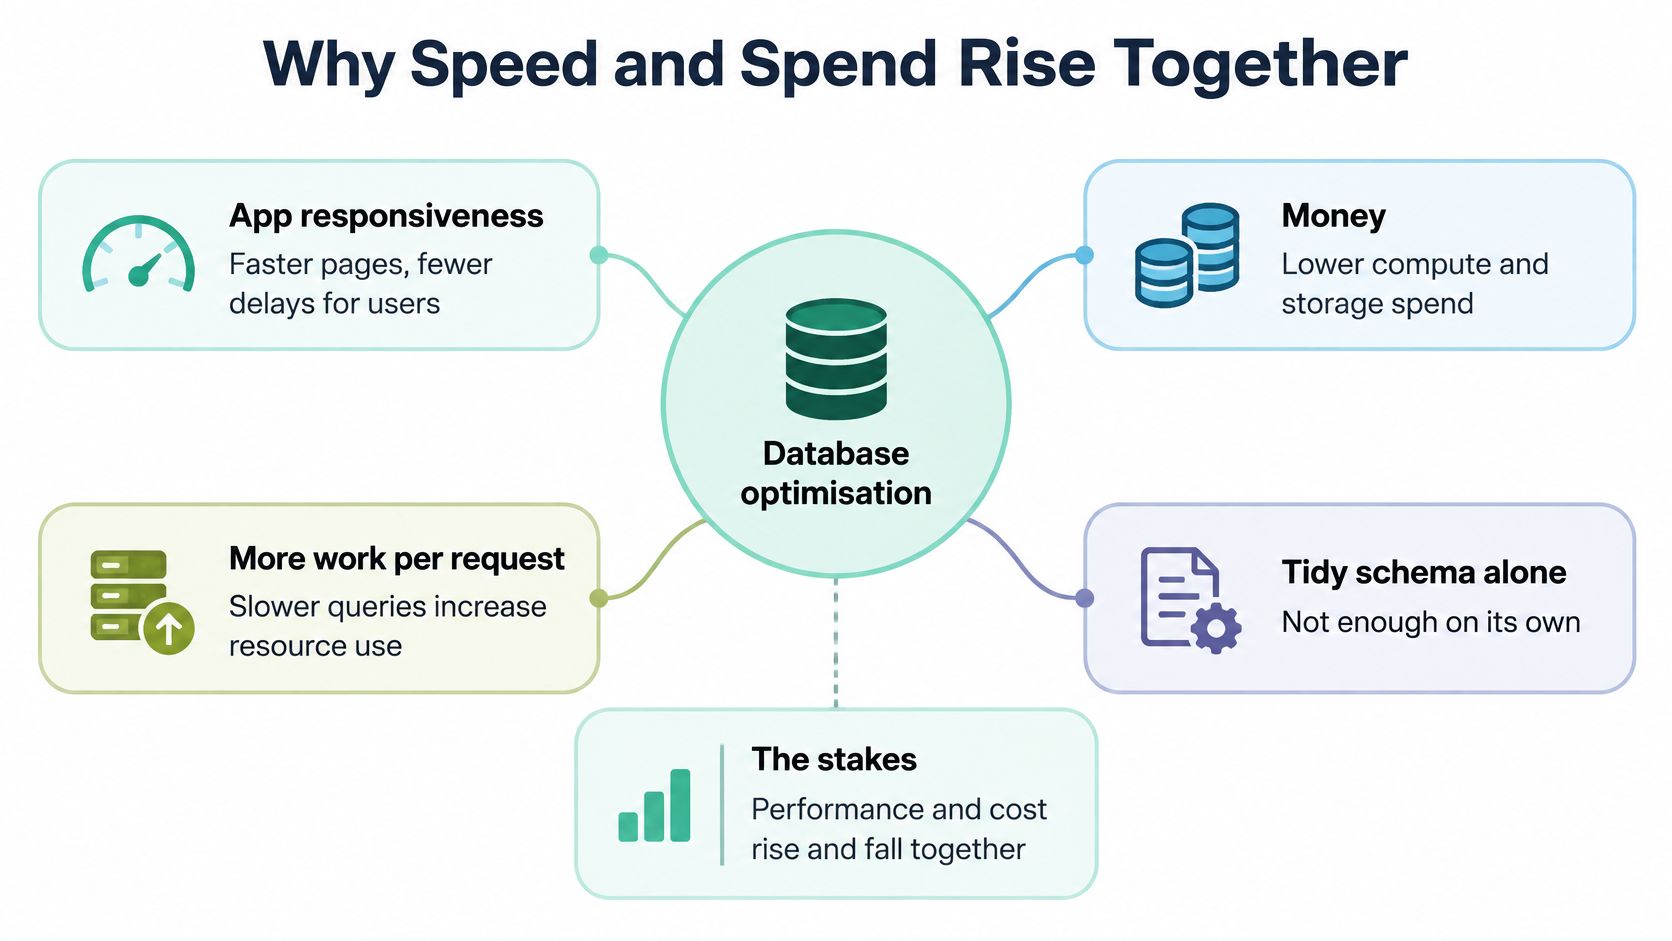
A slow request isn't always costly. A request that repeatedly reads, sorts, and joins far more data than it needs is a stronger warning sign.
Your users experience the wait. You pay for the resources spent during it.
New Zealand's Integrated Data Infrastructure combines de-identified administrative, census, survey, and service information across health, education, taxation, welfare, migration, and justice. By September 2018, it held approximately 166 billion pieces of information in separate SQL tables, illustrating the scale described in MBIE's data and analysis material.
Its importance isn't just size. It brings together population-level information that previously sat across government systems, making analysis across institutional boundaries possible.
At that scale, a poorly structured join or an unnecessary full-table scan can involve billions of records. Query planning, indexes, partitioning, data modelling, maintained statistics, and access controls become part of making the analysis practical.
A founder doesn't need a national platform to face the same kind of problem. Customer tables expand into transaction histories, event streams, and analytics. The amount of work behind an unchanged screen can grow while the screen itself looks much the same.
Don't judge the cost of a request by how simple the page looks.
Suppose a dashboard needs recent activity, but the application asks for a customer's entire history and discards most of it. More compute might help it finish sooner. It doesn't remove the unnecessary reading or transfer.
That's the distinction between adding capacity and reducing work. Both have a place, but they solve different problems.
Cloud migration doesn't settle that distinction. Unmodernised architecture, skills gaps, complexity, and workloads that don't match business priorities can still get in the way. The regional cloud findings discussed below give that caution some weight.
For payments, health records, government-related information, and high-volume events, make the business trade-off explicit:
You don't need to fix everything at once. You need enough evidence to notice expensive growth before reaching for another capacity increase.
Start with the customer request, not a server graph. Record what happens from the click to the finished response, then separate application work, database execution, and network waiting.
For a broader view of that journey, this guide to measuring website performance can help frame the investigation. A quick SQL query doesn't guarantee a quick page.
p95 and p99 latency describe the slow end of the response-time spread. They help you see waits that a flattering average can hide, especially when customers say the app is unreliable rather than always slow.
Pair them with buffer-cache hit rate, which shows how often required data is found in memory; lock waits, where work pauses behind another transaction; CPU use; disk I/O; and transactions per second. Capture the same measures before and after a change, under comparable traffic.
| What users feel | First number to check | Likely place to look next |
|---|---|---|
| A report takes longer as records grow | Query duration and disk I/O | A full scan or large intermediate result |
| Saving pauses during busy periods | Lock-wait time | Transactions blocking one another |
| Reads slow down under load | Buffer-cache hit rate and disk reads | Working data not staying in memory |
| SQL looks quick, but the page drags | Network and application timing | Sequential calls or a cross-region trip |
| Many actions slow down together | CPU use and transactions per second | Shared workload pressure |
These are starting points, not diagnoses. A scan may be sensible for a query that needs most of a table; high CPU alone doesn't tell you which query caused it.
New Zealand's international traffic commonly travels through undersea cables to Australia, Asia, or North America. The data-centre report discussing NZTech's regional findings reports Auckland-to-Sydney latency of approximately 25 ms, notes responsiveness concerns around 150 ms for time-sensitive applications, and illustrates how ten sequential calls can add roughly 250 ms before query execution.
That's why batching related reads matters. Don't make the application cross the Tasman repeatedly to assemble a single screen.
For users in Auckland, Wellington, or Christchurch, placing the application and primary database in the same NZ region removes that trans-Tasman trip between them. The report also identifies low latency and high availability as benefits of Auckland cloud zones.
Once you've found the expensive request, change the work it asks the database to do. Start with structure and query shape, then consider extra layers or capacity.
Logical design describes what your data means and how entities relate. Physical design concerns how the engine stores and finds it: data types, keys, indexes, table layout, and partitions.
Those choices should reflect actual access patterns. A customer-history screen and a financial summary may use the same records but need very different paths through them.
The engine also chooses an execution plan. University of Otago teaching material on query processing explains how it converts a query into relational algebra, considers candidate plans, and estimates their cost using data size and expected intermediate results.
The plain-language habit is shrink the pile before you carry it. Filter rows early, return only needed columns, and delay joins when the query's meaning allows it.
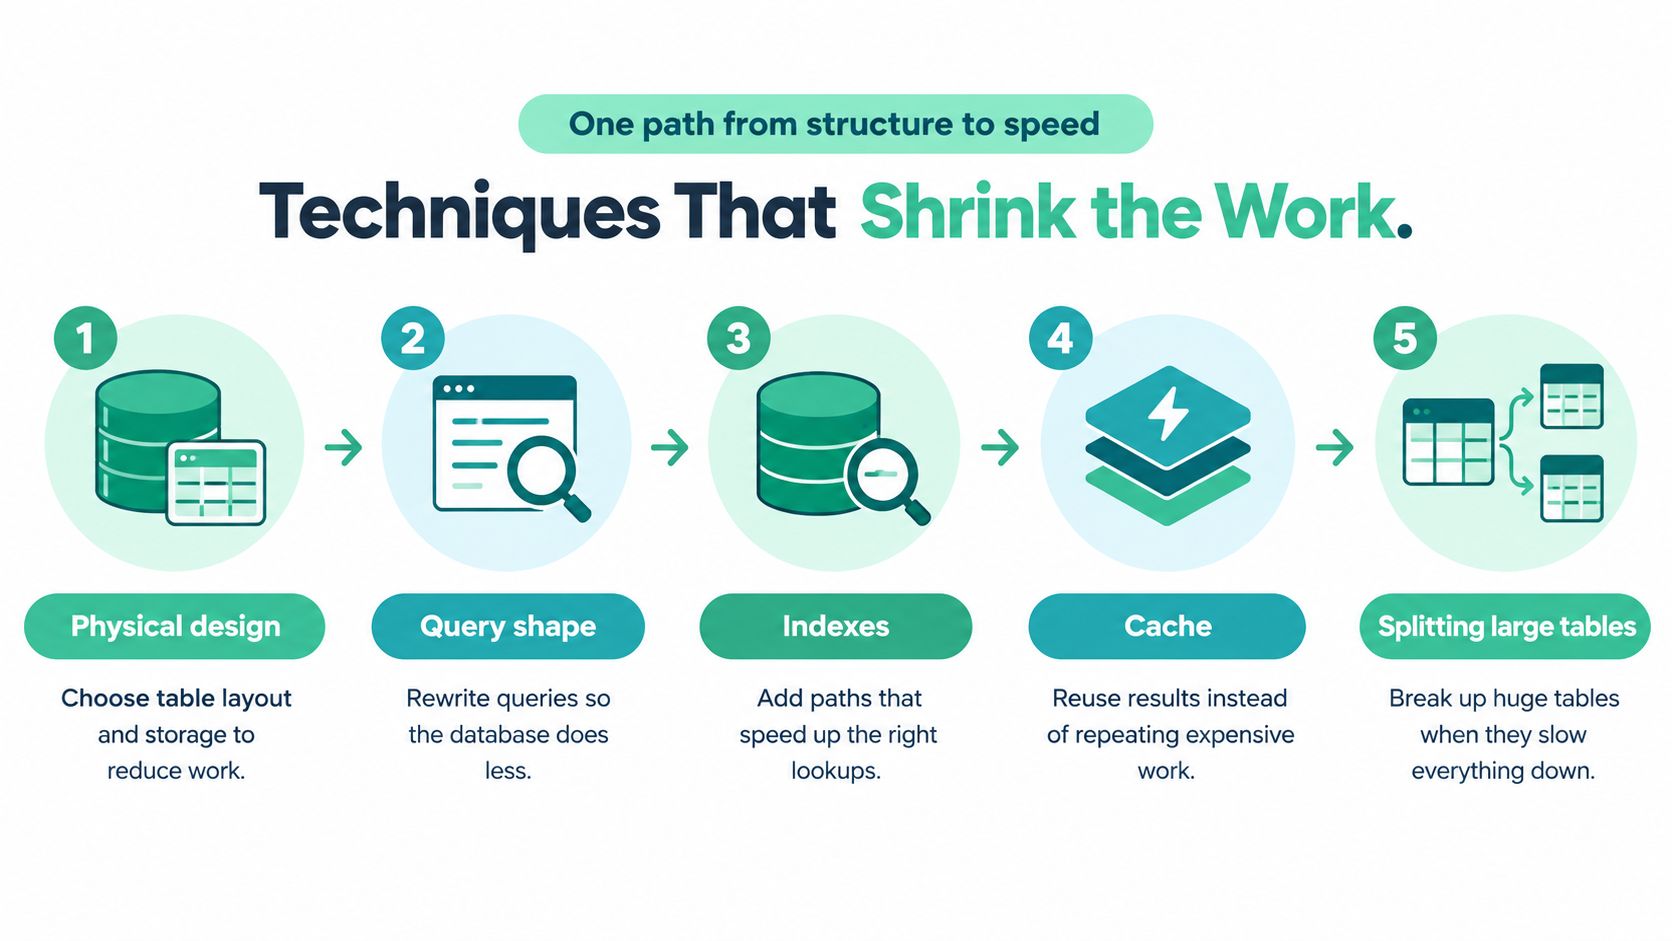
A composite index covers a combination of columns. For a customer activity view, that might mean matching the customer filter and the date sort rather than adding unrelated indexes.
Indexes aren't free. Each affected index needs maintenance during inserts, updates, and deletes, so a faster report can come with slower writes and more storage.
Use EXPLAIN, or your engine's plan viewer, to check what changed. BatchData's EXPLAIN plans for property data queries provides a domain-specific resource for this kind of plan review.
Keep these supporting choices in view:
A cache avoids repeating a lookup, but needs clear freshness rules. A replica serves another copy of the data; it doesn't make the original query cheaper and adds replication work.
Partitioning divides a large table into manageable parts. Sharding distributes data across systems, adding routing, recovery, and operational complexity.
For chatty applications, connection pooling lets requests reuse connections instead of setting them up repeatedly. It won't remove unnecessary calls, so fix those too.
Match hardware and configuration to the measured workload last. More memory or compute may be the right purchase, but it shouldn't substitute for understanding a bad plan.
A Victoria University of Wellington engineering project gives these ideas a concrete setting: retrieving useful results from a substantial HTTP proxy dataset.
The team combined MongoDB indexing, field projection, and lazy loading. The index provided a faster lookup path, projection returned only needed fields, and lazy loading postponed reads until they were required.
In the Victoria University of Wellington project report, the combined approach retrieved the most common HTTP proxies in two minutes, a reported 71% performance improvement compared with lazy loading alone.
That comparison matters. It wasn't a promise that adding an index makes every application faster by the same amount.
The changes addressed different work: finding data, transferring data, and deciding when to fetch it. Together, they improved the tested pipeline.
Testing lesson: Keep the comparison honest. A result belongs to the workload and conditions that produced it.
For a SaaS dashboard or directory page, that's a useful way to think. Don't assume the entire delay lives inside the database search. The application may also fetch fields it never shows or load content nobody has opened.
University of Waikato research on semantic query optimisation describes changing a query without changing its meaning. One example is removing a redundant DISTINCT when selected columns already include a primary or unique key.
The key already guarantees uniqueness. Asking the engine to remove duplicates adds no logical value and can create unnecessary sorting and cleanup.
The research also considers adding or removing restrictions only when meaning stays intact, and retaining information from queries that return no rows. These are quieter improvements than a server upgrade, but they target work the engine needn't perform.
A related Waikato study of the New Zealand Digital Library found that passage-level indexing improved full-text retrieval precision, with overlapping-window passages performing strongest across ranked and Boolean searches. That's a search-quality finding, not a transaction-speed claim.
The shared lesson is to match structure to use. For reports and dashboards on uneven connections, stack measured changes, preserve the answer, and remove indexes that add write cost without helping reads.
Database placement is a choice about speed, cost, and control, not a contest between local and global hosting.
An NZ region can suit a local customer base and in-country processing needs. A wider regional layout may support availability or access to specialised services, but complicates replication, deletion guarantees, and recovery decisions.
Only 50% of surveyed New Zealand organisations said cloud delivered the benefits they expected; 61% reported data-sovereignty concerns, and 61% preferred in-country processing, according to Datacom's annual cloud research.
Those findings are a reason to ask better purchasing questions, not to reject cloud services. Establish which data can leave the country, who can access it, and what happens during failover.
For AI-related products, treat transactional records, analytics, vector indexes, and prompts as separate workloads. Each needs clear access, retention, audit, and deletion rules.
New Zealand's 2025 AI strategy materials warn about misappropriation of cultural knowledge, including Māori knowledge, and identify local infrastructure as a way to improve control, latency, and resilience; the materials also record 1,292 cyber incidents handled through the NCSC's general triage process in Q1 2025, with reported direct losses of NZ$7.8 million.
The fastest design isn't a good production design if it widens exposure or weakens recovery.
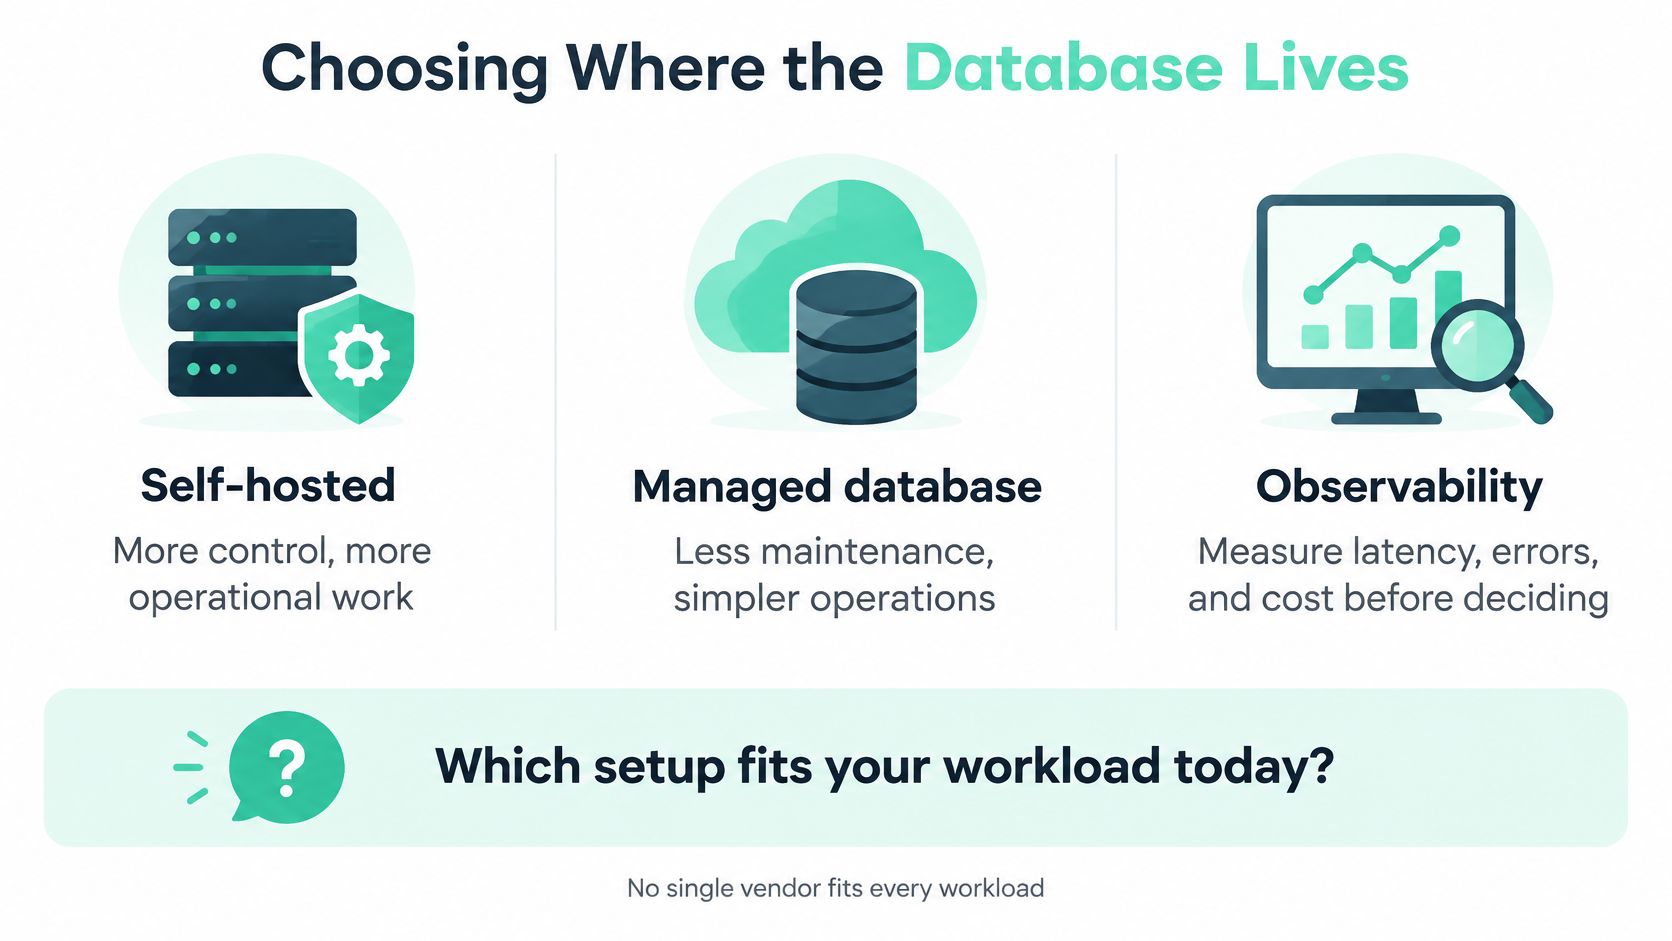
| Choice | What you gain | What you still own |
|---|---|---|
| Self-hosted database | More direct control over configuration | Maintenance, recovery, security, and capacity work |
| Managed database | Less routine infrastructure maintenance | Schema quality, queries, access rules, and service settings |
| Cross-region layout | More placement and service choices | Network delay, replication rules, and residency checks |
Compare managed PostgreSQL or MySQL offerings from major cloud providers against their actual NZ and Sydney regional availability. Sydney remains a nearby choice when the required service has no NZ zone, with the network trade-off established earlier.
Pair the service with EXPLAIN or its plan view, a request profiler, and metrics for tail latency, locks, and I/O. This guide to cloud computing infrastructure provides useful context before committing.
NZ Apps is an independent NZ and Australian directory and editorial site covering app and tech companies. Alongside provider documentation, it's one resource for comparing local operators, managed-service partners, monitoring firms, and regional coverage.
Database optimisation can sound endless. Give it a firm boundary instead: investigate a customer journey, test a specific change, and decide whether the evidence supports shipping it.
The aim isn't a perfect database. It's a smaller, safer amount of work behind an action customers care about.
Keep the earlier Otago heuristic close: reduce rows and columns early when the result stays the same. It's a useful question to bring to a plan review, not permission to rewrite queries without testing.
Use representative traffic in a controlled environment, with sensitive data protected. Don't copy production rows into a vector or analytics store until retention and access rules are clear.
Write down the expected gain, the correctness checks, and the rollback path before changing production. If infrastructure settings change too, infrastructure as code can help make the setup repeatable rather than dependent on someone remembering console clicks.
Measure the improvement you intended, then check what became worse.
This week, profile a user journey and choose its most expensive query. Test a structural change against a protected copy or representative replay of real traffic, then record latency and cost before and after, alongside correctness, write impact, and errors.
If the evidence points to outside help or different hosting, use the regional directory and related coverage to shortlist NZ or Australian operators. Take them the measurements, not just a request for a bigger server.
Visit NZ Apps to compare app and tech companies across New Zealand and Australia and read practical regional coverage. Use the directory to shortlist database, infrastructure, or monitoring partners, then bring your query plans and before-and-after measurements to the conversation.
Add your NZ or Australian app or tech company to the NZ Apps directory and get discovered by founders and operators across the region.
Get ListedReach tech decision-makers across New Zealand and Australia. Sponsored and dofollow editorial links, permanent featured listings, and sponsored articles on a DA30+ .co.nz domain.
See Options